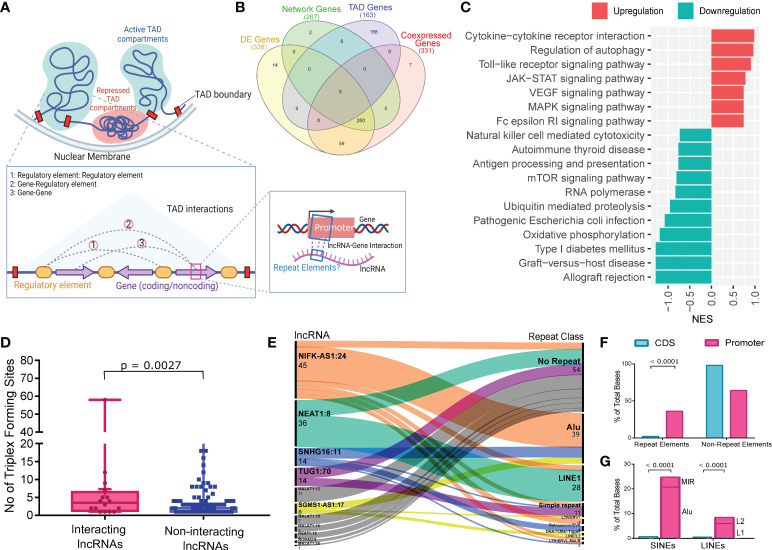
Figure 4.
LncRNAs Interaction with the TAD genes and Repeat elements abundance at the Interaction sites. (A) Illustration of the TAD, type of interactions within the TAD and homology-based interaction between the lncRNA and promoter region of genes from the same TAD. (B) Venn diagram showing the number of protein coding genes from different steps of analysis and their overlap. (C) GSEA of the genes from the same TAD as of the interacting lncRNAs. The x-axis represents the Normalized Enrichment Score (NES), while the color represents the expression of the pathways. (D) Number of Triplex Forming Sites (TFS) between interacting lncRNAs and non-interacting lncRNAs. Upper bar shows statistical significance. (E) Repeat element abundance at the site of interaction within lncRNAs. The number of interacting sites within the lncRNAs and the corresponding repeat elements at these sites are represented in the alluvial plot on left and right sides, respectively. (F) Barplot showing the repeat element distribution between the promoter region and CDS region of the interacting TAD genes. Total bases covered by repeat elements were normalized against the total bases of the promoter and CDS. (G) Stacked bar plot showing the abundance of SINEs and LINEs; and Alu and LINE1 within SINEs and LINEs respectively, between the promoter and the CDS region. L1 and L2 represent LINE1 and LINE2 respectively. Upper bar shows statistical significance.

