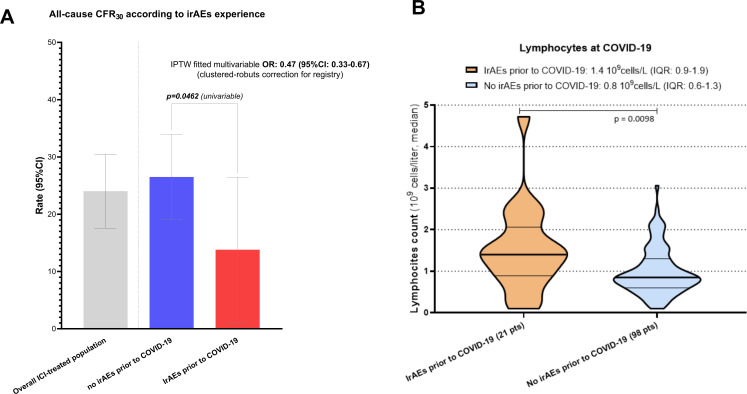
Figure 4.
(A) Histogram plot summarizing the all-cause 30-day case fatality rate (CFR30) analysis according to the occurrence of any grade immune-related adverse events prior to COVID-19. Inverse probability of treatment weighing (IPTW) fitted adjusted OR for the risk of death at 30 days with clustered robust 95% CI correction for the data source is presented. All rates with 95% CI are available in online supplemental table 9. Adjusting covariates were country of origin, primary tumor, tumor stage at COVID-19 and vaccination status. Full multivariable model is available in online supplemental table 11. (B) Violin plot reporting the median absolute lymphocyte count at COVID-19 (within 1 week of diagnosis) according to the prior occurrence or any grade irAEs. IrAEs, immune-related adverse events.

