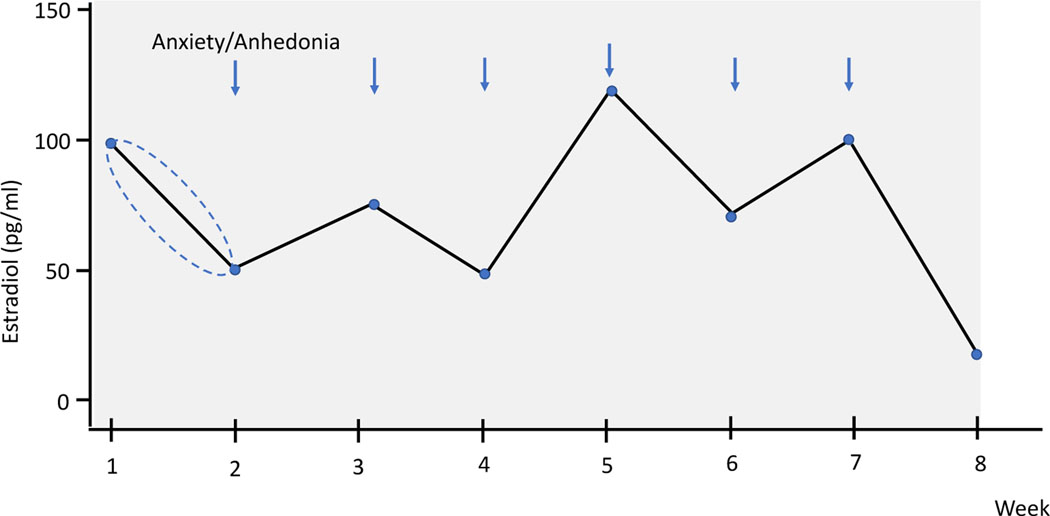
Figure 1.
Stylistic figure depicting the calculation of the correlations between the change in E2 from the past week based on two methods: 1) including the direction of change and 2) using the absolute change in E2 from the past week (directionless) with mood (anxiety and anhedonia) at the index week. In the figure, there is a 50pg/ml decrease in E2 from week 1 to week 2. In one calculation: , the value −50 (with direction) is correlated with the anxiety value at week 2. In the other calculation, the value 50 (without direction) is correlated with the anxiety value at week 2. Both calculations were used for every index week, resulting in two overall correlation coefficients for anxiety for every participant (one including the direction and one without the direction). The same procedure was employed for calculating the correlations between changes in E2 and changes in anhedonia symptoms.

