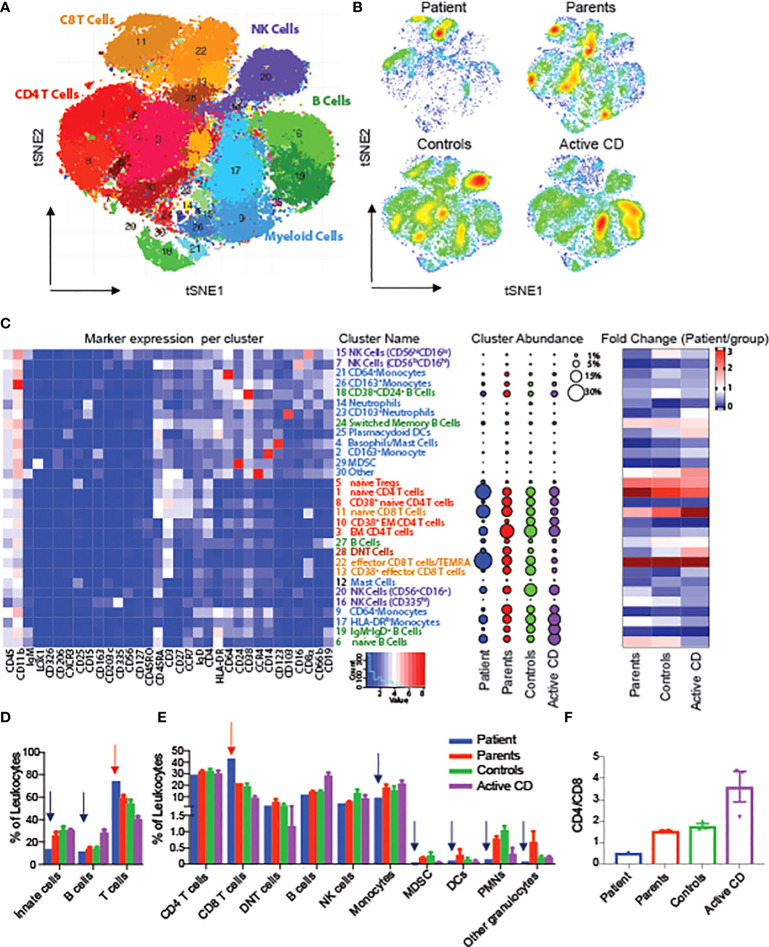
Figure 3.
Alterations in circulating leukocytes in a patient with RIPK1 deficiency. tSNE of Phenograph analysis of PBMCs as a (A) conglomerate of all samples with individual cellular population shown or as (B) density plots of the individual groups. (C) Heatmap of the markers expressed in each cluster on the left-hand-side, cluster abundance as a percent of all leukocytes in the middle and fold change of each cluster for each group shown as compared to the RIPK1-deficient Patient 1. (D, E) Clusters combined by the immune populations indicated. (F) CD4 to Cd8 ratio. Blue arrow-relative reduction and red arrow-relative increase in the RIPK1 patient compared to all other groups.

