Figure 1.
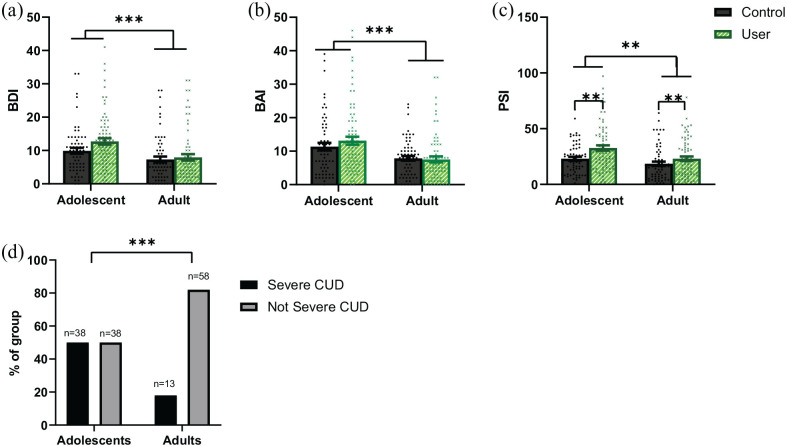
Bar charts showing means, error bars representing 95% CIs around the mean, and distribution of the data in adolescent controls (n = 63) and users (n = 76), and adult controls (n = 64) and users (n = 71) for (a) BDI scores. Adolescents have greater BDI scores than adults (***p < 0.001 adjusted and unadjusted), no difference between users and controls, and no interaction. (b) BAI scores. Adolescents have greater BAI scores than adults (***p < 0.001 adjusted and unadjusted), no difference between users and controls, and no interaction. (c) PSI-a scores. Adolescents have greater PSI-a scores than adults (**p = 0.001 unadjusted, p = 0.015 adjusted), and users have greater PSI-a scores than controls (**p = 0.01 unadjusted, p = 0.014 adjusted). (d) Percentage of adolescent and adult users with and without severe CUD. Adolescents were more likely to have severe CUD than adults (***p < 0.001 unadjusted, p = 0.004 adjusted). In (a–c), controls are shown by black circles and dark grey bars; users are shown by green/grey crosses and light green/grey bars with diagonal stripes. In (d), the percentage of participants with severe CUD is shown by the black bar and the percentage of participants without severe CUD is shown by the grey bar.
BAI: Beck anxiety inventory; BDI: Beck depression inventory; CI: confidence interval; CUD: cannabis use disorder; PSI-a: psychotomimetic states inventory-adapted

