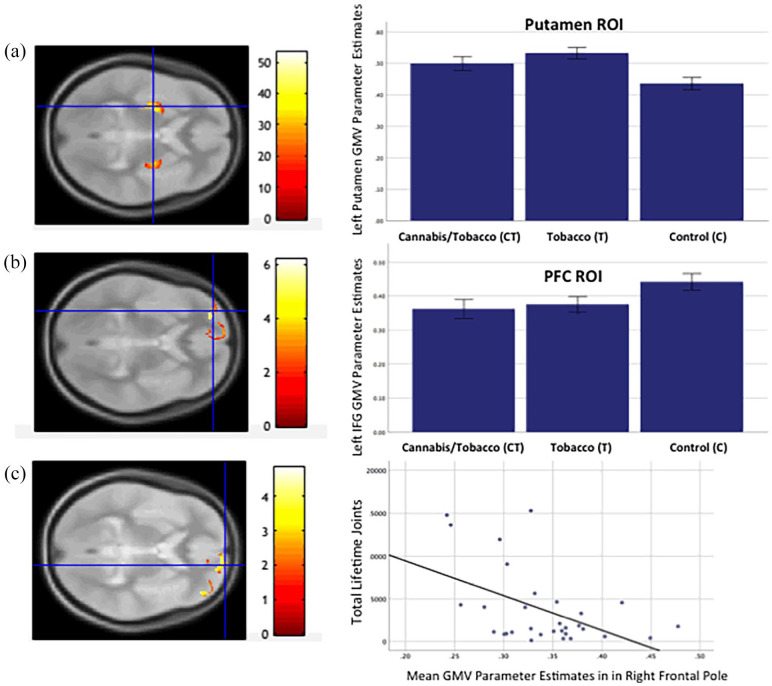
Figure 1.
(a) SPM showing Group effect (axial orientation) in bilateral putamen ROI (CT > C) and left putamen (T > C) (p = 0.0001 unc. for illustration). Bar chart shows GMV parameter estimates by group in putamen peak. (b) SPM showing Group effect (axial orientation) in bilateral PFC ROI (CT and T > C) in left inferior frontal (CT > C) (p = 0.001 unc. for illustration). Bar chart shows GMV parameter estimates by group in left inferior frontal gyrus. (c) SPM showing Group effect (axial orientation) in bilateral PFC ROI (CT > C) and right frontal pole (CT > C) (p = 0.001 unc. for illustration). Scatterplot showing right frontal pole parameter estimates against total lifetime joints in the CT group.
GMV: grey matter volume; PFC: prefrontal cortex; ROI: region of interest.

