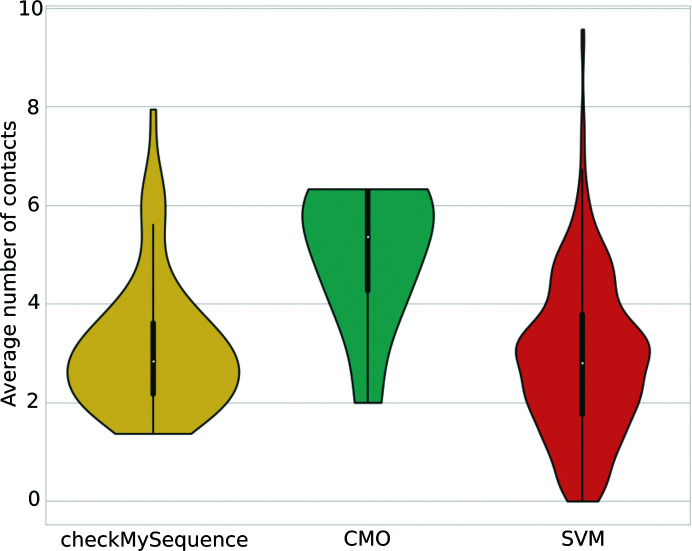
Figure 11.
Distribution of the average number of contacts predicted for residues involved in sequence-register errors that could only be predicted by checkMySequence (yellow), the contact maximum overlap approach (turquoise) or the trained SVM (red). Black bars inside the violins depict the interquartile range, with a white dot showing the median and black whiskers showing the maximum and minimum quartiles.

