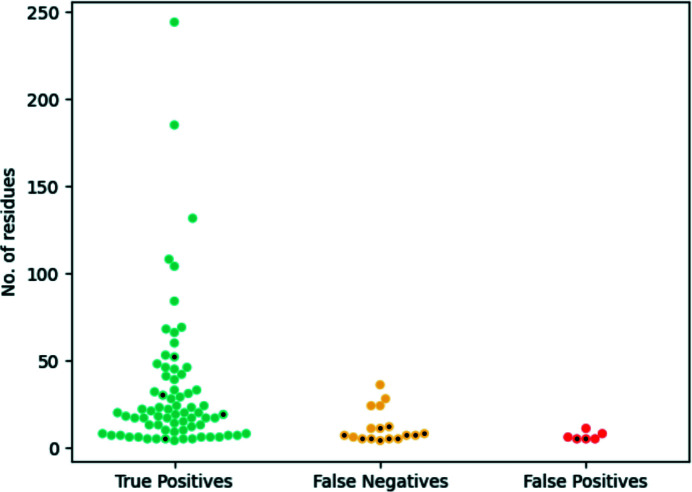
Figure 6.
Performance of the sequence reassignment of register errors in the EM modelling challenges using contact-map alignment. The vertical axis shows the number of residues present in the register errors, which are represented with coloured points. Coloured points with a black dot represent register errors where residues had, on average, less than three predicted contacts. True positives (turquoise) are register errors where the correct sequence register was revealed after contact-map alignment (71 instances, of which four have less than three contacts per residue on average). False negatives (yellow) are register errors where no contact-map misalignment was detected at all (17 instances, of which 11 have less than three contacts per residue on average). False positives (red) are regions of the models where a contact-map misalignment was detected despite there being no register error (six instances, of which two have less than three contacts per residue on average). True negatives have been omitted for clarity; they consist of 6152 residues that are not involved in any kind of modelling error where no contact-map misalignment was detected.

