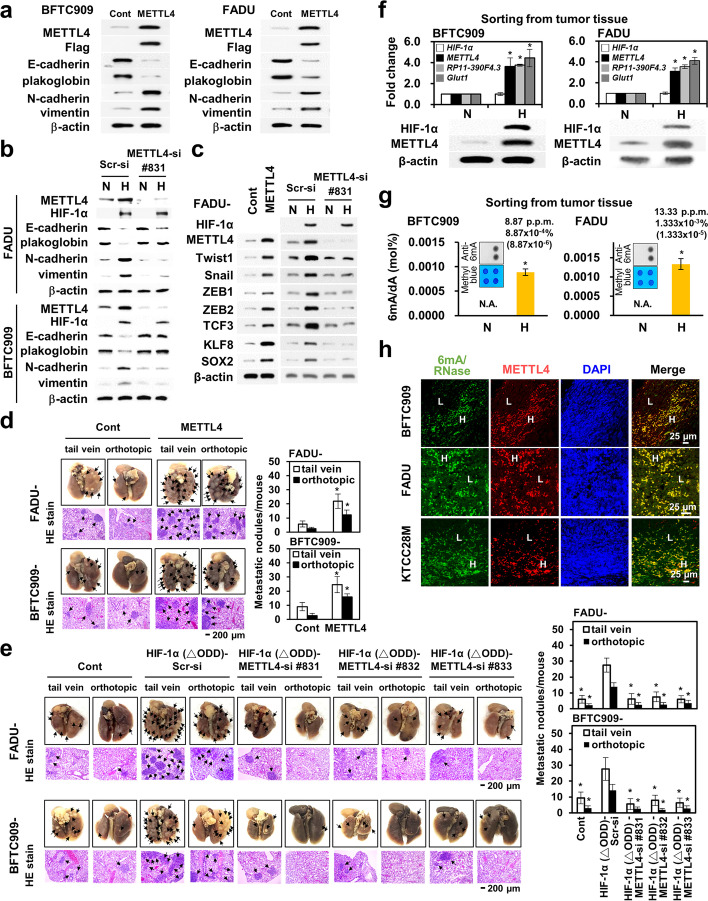
Fig. 2.
METTL4 is essential in hypoxia-induced EMT and in vitro/in vivo metastatic activity. a Overexpression of METTL4 induced EMT in BFTC909 and FADU cells by Western blot analysis. The cell clone transfected with the control vector was used as a control. b Knockdown of METTL4 reversed the expression of EMT markers regulated by hypoxia in BFTC909 and FADU cells. c Overexpression of METTL4 induced the expression of a set of EMT transcriptional regulators and knockdown of METTL4 abolished the activation of these EMT regulators induced by hypoxia. d Overexpression of METTL4 induced increased numbers of metastatic lung nodules in mice in tail vein and orthotopic implantation experiments. Representative gross anatomy and histology are shown on the left; measurement of metastatic lung nodules is shown on the right. e Knockdown of METTL4 significantly decreased the increased metastatic lung nodules in mice injected with cells overexpressing a HIF-1α constitutively active mutant. Representative gross anatomy and histology are shown on the left; measurement of metastatic lung nodules is shown on the right. f Hypoxic tumor cells sorted from xenografted tumors from BFTC909 and FADU cells show the increased HIF-1α and METTL4 protein levels together with increased HIF-1α target gene expression. Glut1 activation was used as a positive control. N, normoxia; H, hypoxia. Normoxic cells were used as a control. g Hypoxic tumor cells sorted from xenografted tumors from BFTC909 and FADU cells show an increase in the 6mA levels. Corresponding 6mA dot blots with methyl blue loading controls are shown together with bar graphs. N, normoxia; H, hypoxia. h Immunofluorescence staining shows the co-staining of 6mA and METTL4 in xenografted tumors from BFTC909, FADU, and KTCC28M cells. Green fluorescence: 6mA staining (RNase treatment); red fluorescence: METTL4 staining. Cell nuclei were stained by DAPI. H, highly colocalized area; L, less colocalized area. The asterisk (*) indicated statistical significance (P<0.05) between experimental and control groups

