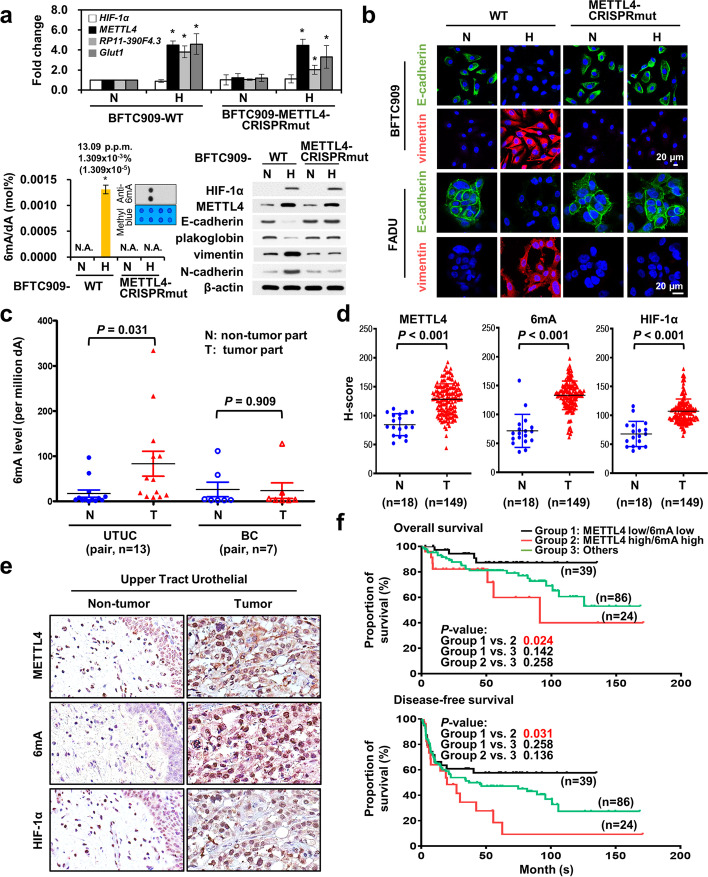
Fig. 3.
The essential role of the enzymatic activity of METTL4 in hypoxia-induced phenotypes and clinical implications. a Mutation of the enzymatic site of METTL4 by a prime-cutting CRISPR-Cas9 approach in BFTC909 cells abolished the induction of EMT by hypoxia and significantly decreased the RNA expression of RP11-390F4.3 and Glut1. The induction of 6mA levels was abolished in enzymatically inactive METTL4 mutant BFTC909 cells. N, normoxia; H, hypoxia. The normoxic condition for METTL4 wild type BFTC909 cells was used as a control. A corresponding 6mA dot blot with methyl blue loading control is shown together with the bar graph. The asterisk (*) indicated statistical significance (P<0.05) between experimental and control groups. b Immunofluorescence staining shows the abolishment of EMT induction by hypoxia in the enzymatically inactive METTL4 mutant FADU and BFTC909 cells. Green fluorescence represented staining of E-cadherin; red fluorescence represented staining of vimentin. Cell nuclei were stained by DAPI. N, normoxia; H, hypoxia. The normoxic condition for METTL4 wild type BFTC909 and FADU cells were used as a control. c Increased 6mA levels in UTUC, but not in bladder cancer (BC), patient samples. d Increased METTL4, 6mA, and HIF-1α levels by immunohistochemistry staining in the tumor part (T) (vs. the normal part (N)) of UTUC patient samples are shown by H-score measurement. The error bars represented the standard deviation (SD). Student’s t test was used to compare two groups of independent samples. e A representative case of immunohistochemistry staining of UTUC patient samples using antibodies against METTL4, 6mA, and HIF-1α between normal and tumor tissues. f Co-expression of METTL4 and 6mA predicted a poor prognosis of UTUC patients in either overall survival or disease-free survival by Kaplan-Meier analysis. Subgroup analysis of overall survival and disease-free survival of UTUC cases according to the expression profile of METTL4 low/6mA low (Group 1), METTL4 high/6mA high (Group 2), and others (Group 3) in tumors. P values of the comparison between each group are shown

