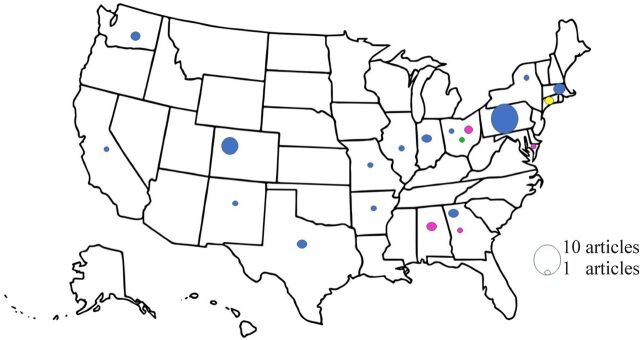
Figure 4.
Geographical distribution of dog bite studies by main areas of focus. Adapted for use from Teelion (www.etsy.com/shop/DigitaLion) by TB and KNP. Permission for use was granted. Blue = dog bite characterization; magenta = education; green = psychosocial; yellow = dog bite characterization and education; *National database = dog bite characterization (not shown). The size of each dot correlates with the number of studies which met inclusion from that US state, with the smallest dot representing 1 study and the largest dot representing 10 studies.

