Figure 2.
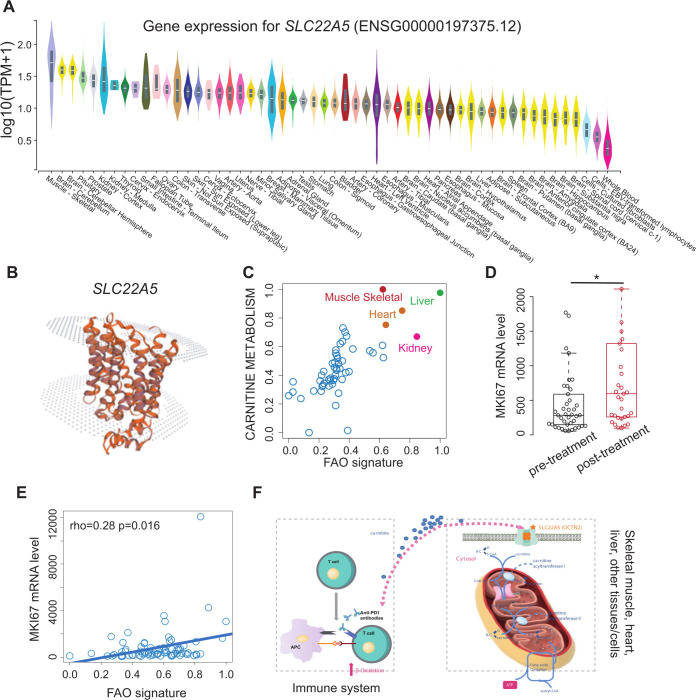
ICI associates with fatty acid oxidation (FAO) activation. (A) Comparison of SLC22A5 mRNA level among different tissues based on genotype-tissue expression project. (B) The structure of SLC22A5 (OCTN2) visualized by SWISS-MODEL. (C) The scatter plot of carnitine metabolism (y-axis) and FAO signature (x-axis) across different tissues. The tissues with high calcium ion transport and FAO signature scores are colored in red (muscle tissue), orange (heart), green (liver), and pink (kidney). (D) Comparison of MKI67 mRNA levels between ICI pretreatment and post-treatment groups (dataset derived from GSE141479). Wilcoxon’s rank-sum test, p-value<0.05:*. (E) Correlation between FAO signature and MKI67 mRNA levels based on the expression profile derived from GSE141479. (F) Schematic diagram illustrating the competition between the immune system (left panel) and muscle/heart/liver tissues (right panel) for carnitine following ICI treatment. ICI, immune checkpoint inhibitor.

