Figure 2.

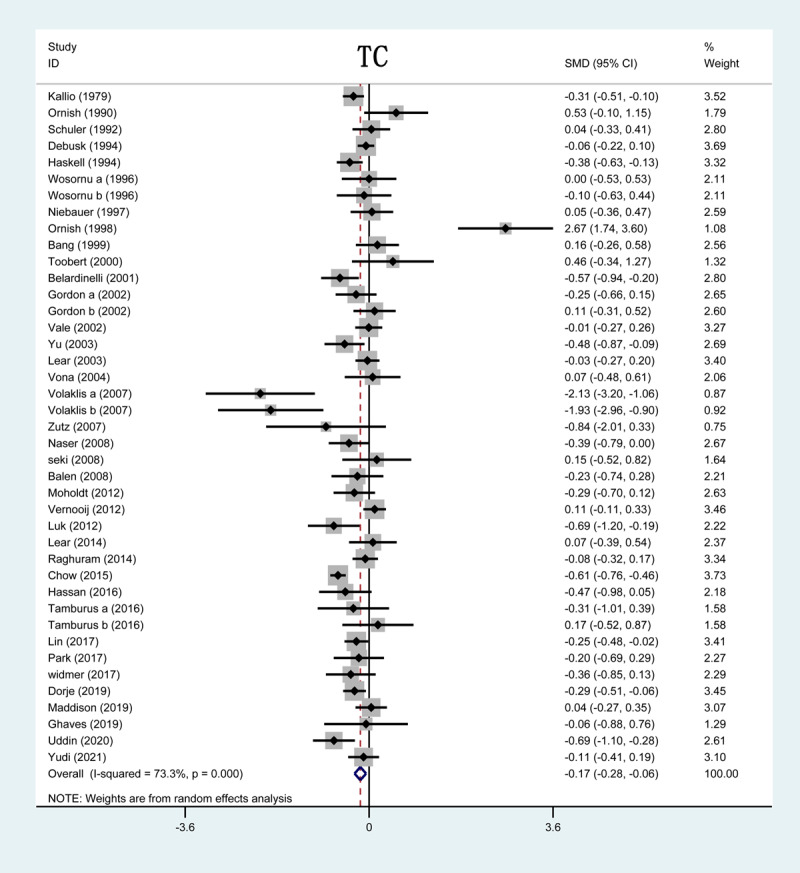
Forrest plot of TC levels after CR treatment. TC: total cholesterol; CR: cardiac rehabilitation; SMD: standardized mean difference.

Forrest plot of TC levels after CR treatment. TC: total cholesterol; CR: cardiac rehabilitation; SMD: standardized mean difference.