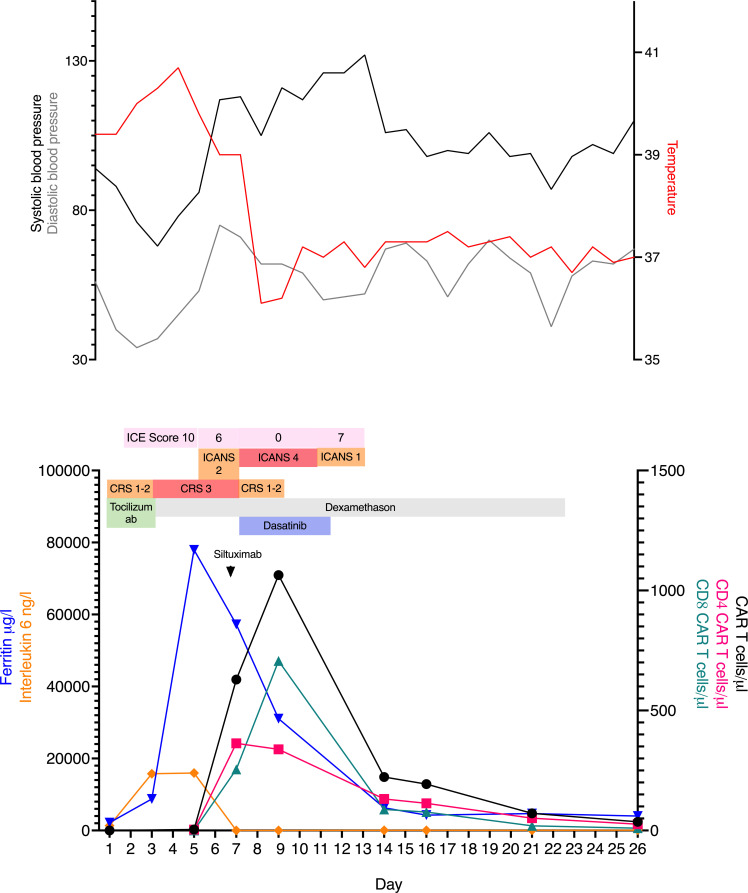
Figure 1.
Course of CAR T-cell expansion during treatment with dasatinib. Clinical course, selected laboratory parameters and CAR T-cell expansion in the first 26 days after CAR T-cell infusion. The upper graph shows the changes in body temperature and systolic and diastolic blood pressure after infusion; the red line shows the maximum temperature, the black line shows the minimum systolic blood pressure, and the gray line indicates the minimum diastolic blood pressure per day. The graphic below shows the course of the inflammatory markers (ferritin and interleukin-6) as well as the course of the CAR T-cells and the interventions. Dexamethasone treatment was started on day 3 and tapered over 23 days. Five doses of tocilizumab were administered between days 1 and 4, and siltuximab on day 6. Dasatinib was administered from day 7 to day 13. The CAR T-cells were measured by flow cytometry and given as absolute values (cells/μL). CAR T, Chimeric antigen receptor T-cell; CRS, cytokine release syndrome; ICANS, immune effector cell-associated neurotoxicity syndrome; ICE, immune effector cell encephalopathy.

