Figure 3.
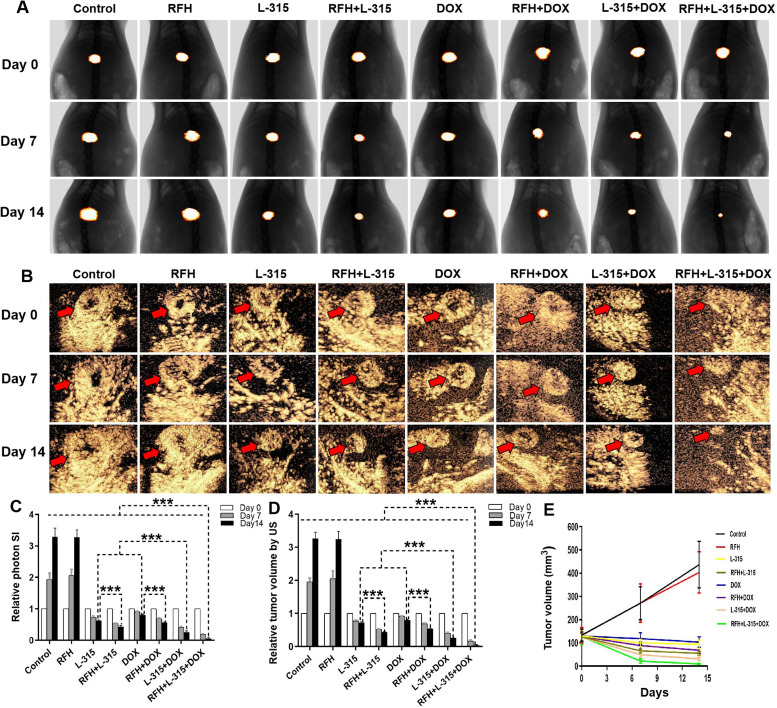
Optical/X-ray imaging and contrast-enhanced ultrasound imaging follow-up of treated tumors among eight animal groups. The Optical/X-ray imaging (A) and contrast-enhanced ultrasound imaging (B) shows the tumors (golden-yellow color, red arrows) presented with smaller tumor size in the triple combination treatment (RFH+LTX-315 (L-315)+DOX) group, compared with other seven treatment groups (***p<0.001). (C, D) The quantitative analysis shows a significantly lower relative optical signal intensity and smaller relative tumor volume in the triple combination treatment (RFH+LTX-315 (L-315)+DOX) group, compared with other seven treatment groups (***p<0.001). (E) Tumor growth chart shows the tumors in the triple combination treatment group with the smallest tumor size at 7 and 14 days after treatments, compared with other seven treatment groups. n=6 in each group. Error bars represent SD. RFH, radiofrequency hyperthermia; SI, signal intensity.

