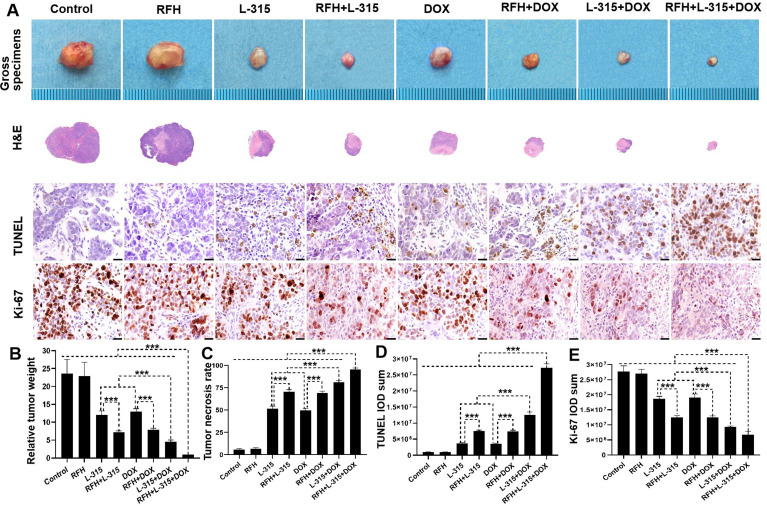
Figure 4.
Pathologic analysis of the tumors in eight treatment groups. (A, B) Representative tumors harvested from different groups, showing the smallest tumor size/weight in the triple combination treatment (RFH+LTX-315 (L-315)+DOX) group, compared with other seven treatment groups (***p<0.001). (A, C–E) The H&E, TUNEL, and Ki-67 staining further confirms a significantly higher tumor necrosis rate, more apoptotic cells (yellow brown dots), and fewer proliferating cells (yellow brown dots) in the triple combination treatment, compared with other seven treatment groups (Scale bars, 20 µm) (***p<0.001). n=6 in each group. Error bars represent SD. RFH, radiofrequency hyperthermia; TUNEL, transferase dUTP nick end labeling.

