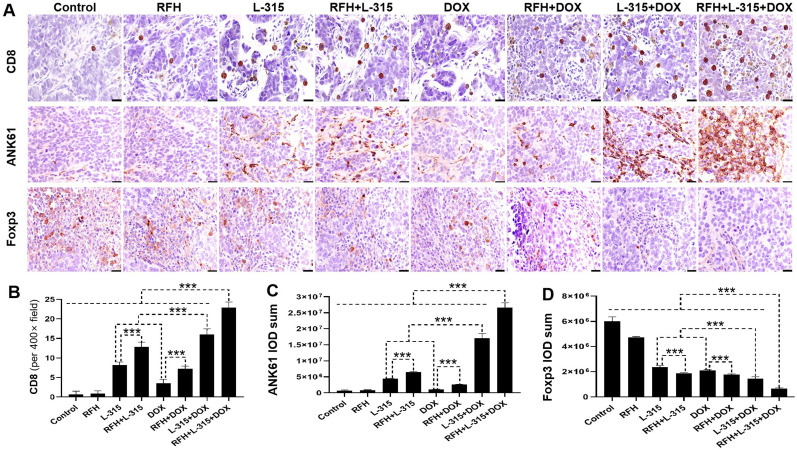
Figure 5.
Immunohistochemical analysis of tumors among different treatment groups. (A with B, C) CD8 staining for CD8+T cells and ANK61 staining for natural killer (NK) cells in the treated tumors demonstrate a significantly higher number of CD8+ T cells and NK cells (brown color) in the triple combination treatment (RFH+LTX-315 (L-315)+DOX) group, compared with other seven treatment groups (***p<0.001). (A with D) The Foxp3 staining for regulatory T cells (Tregs, brown color) further confirms significantly decreased numbers of Tregs in the triple combination treatment, compared with other seven treatment groups (***p<0.001) (Scale bars, 20 µm). n=6 in each group. Error bars represent SD. RFH, radiofrequency hyperthermia.

