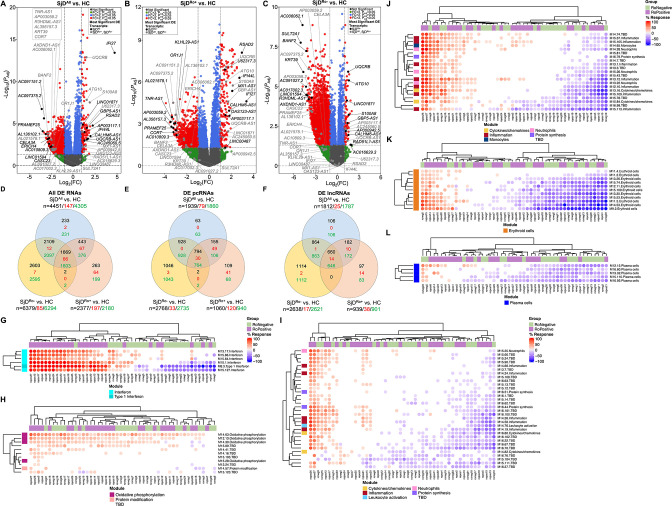
Figure 1.
Protein-coding (pc)RNAs and long non-coding (lnc)RNAs are differentially expressed in the whole blood of SjD cases compared with healthy controls (HCs). (A–C) Differentially expressed (DE) transcripts from whole blood RNA-sequencing analysis of (A) all SjD cases (SjDAll; n=50), (B) anti-Ro positive SjD cases (SjDRo+; n=27) or (C) anti-Ro negative SjD cases (SjDRo−; n=23) compared with HCs (n=27). Y-axis shows the −log10 of the FDR-adjusted p value (padj); x-axis shows the log2 of the fold change (FC). Black dots indicate the top three upregulated and downregulated pcRNAs and lncRNAs in the analysis. Grey dots indicate the top three upregulated and downregulated pcRNAs and lncRNAs in the other analyses. (D–F) Distribution of (D) all DE transcripts, (E) DE pcRNAs or (F) DE lncRNAs across the three analyses. Black text indicates total DE transcripts; red text indicates upregulated transcripts; green text indicates downregulated transcripts. (G–L) Hierarchical clustering of annotated module aggregates across individual SjDRo+ (purple) or SjDRo− (green) cases. Displayed individual modules had DE of >20% of constitutive transcripts in at least one case. Colour gradient indicates the proportion of DE transcripts ranging from 100% increased (red) to 100% decreased (blue), respective to HCs. FDR, false discovery rate; SjD, Sjögren’s disease.

