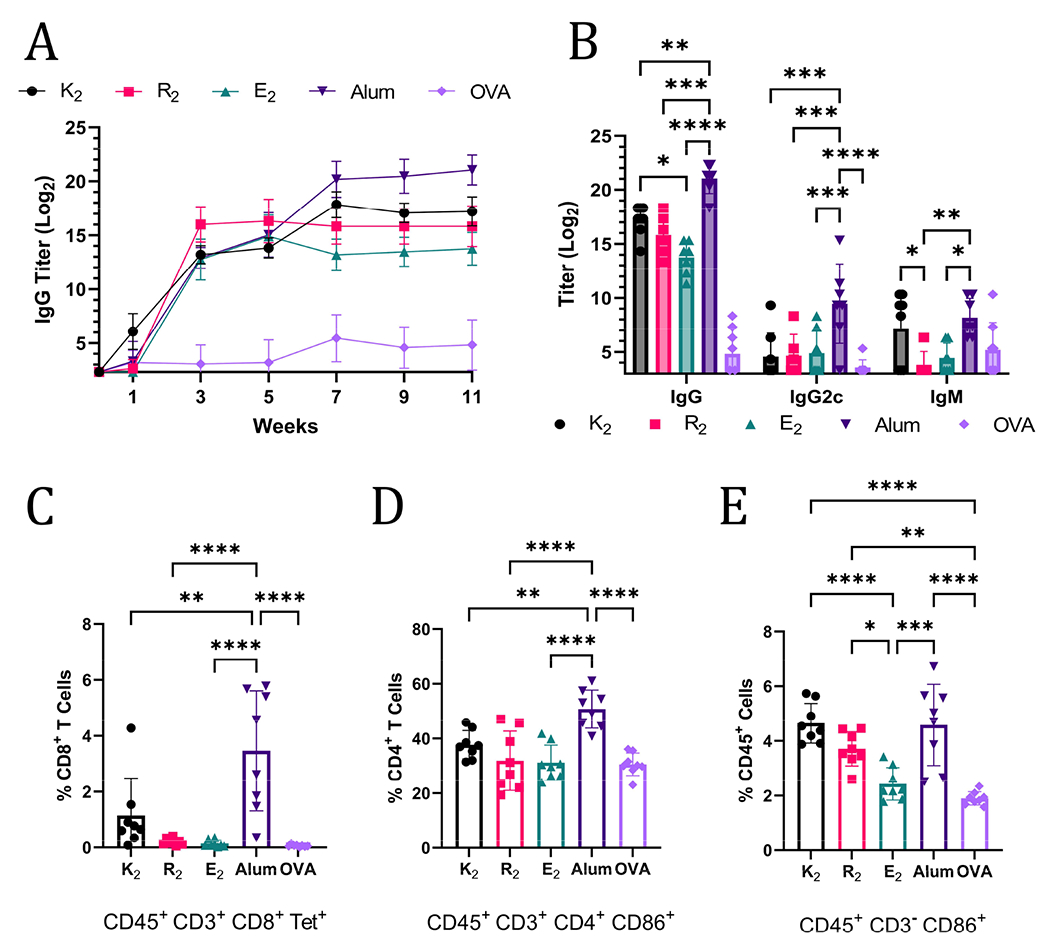
Figure 4.

A) Anti-OVA IgG titers over the course of 11-weeks after OVA vaccination administered with MDPs, alum, or no adjuvant (n = 6-8). B) Week 11 anti-Ova titers of IgG, IgG2c, and IgM. All MDPs generated statistically significantly higher IgG titers than the OVA-alone injection but are not marked on the graph for the sake of clarity. Panels C-E show data from flow cytometry on splenocytes of vaccinated C57BL/6J mice harvested 3-weeks after inoculation (n=8). C) Tetramer+ CD8+ T cells graphed as a percent of CD45+CD3+CD8+ cells. D) Activated CD4+ T cells graphed as a percent of CD45+ CD3+CD4+ cells that express CD86. E) Activated non-T lymphocyte immune cells (CD45+CD3−) graphed as a percent of CD45+cells that express CD86.
