Figure.

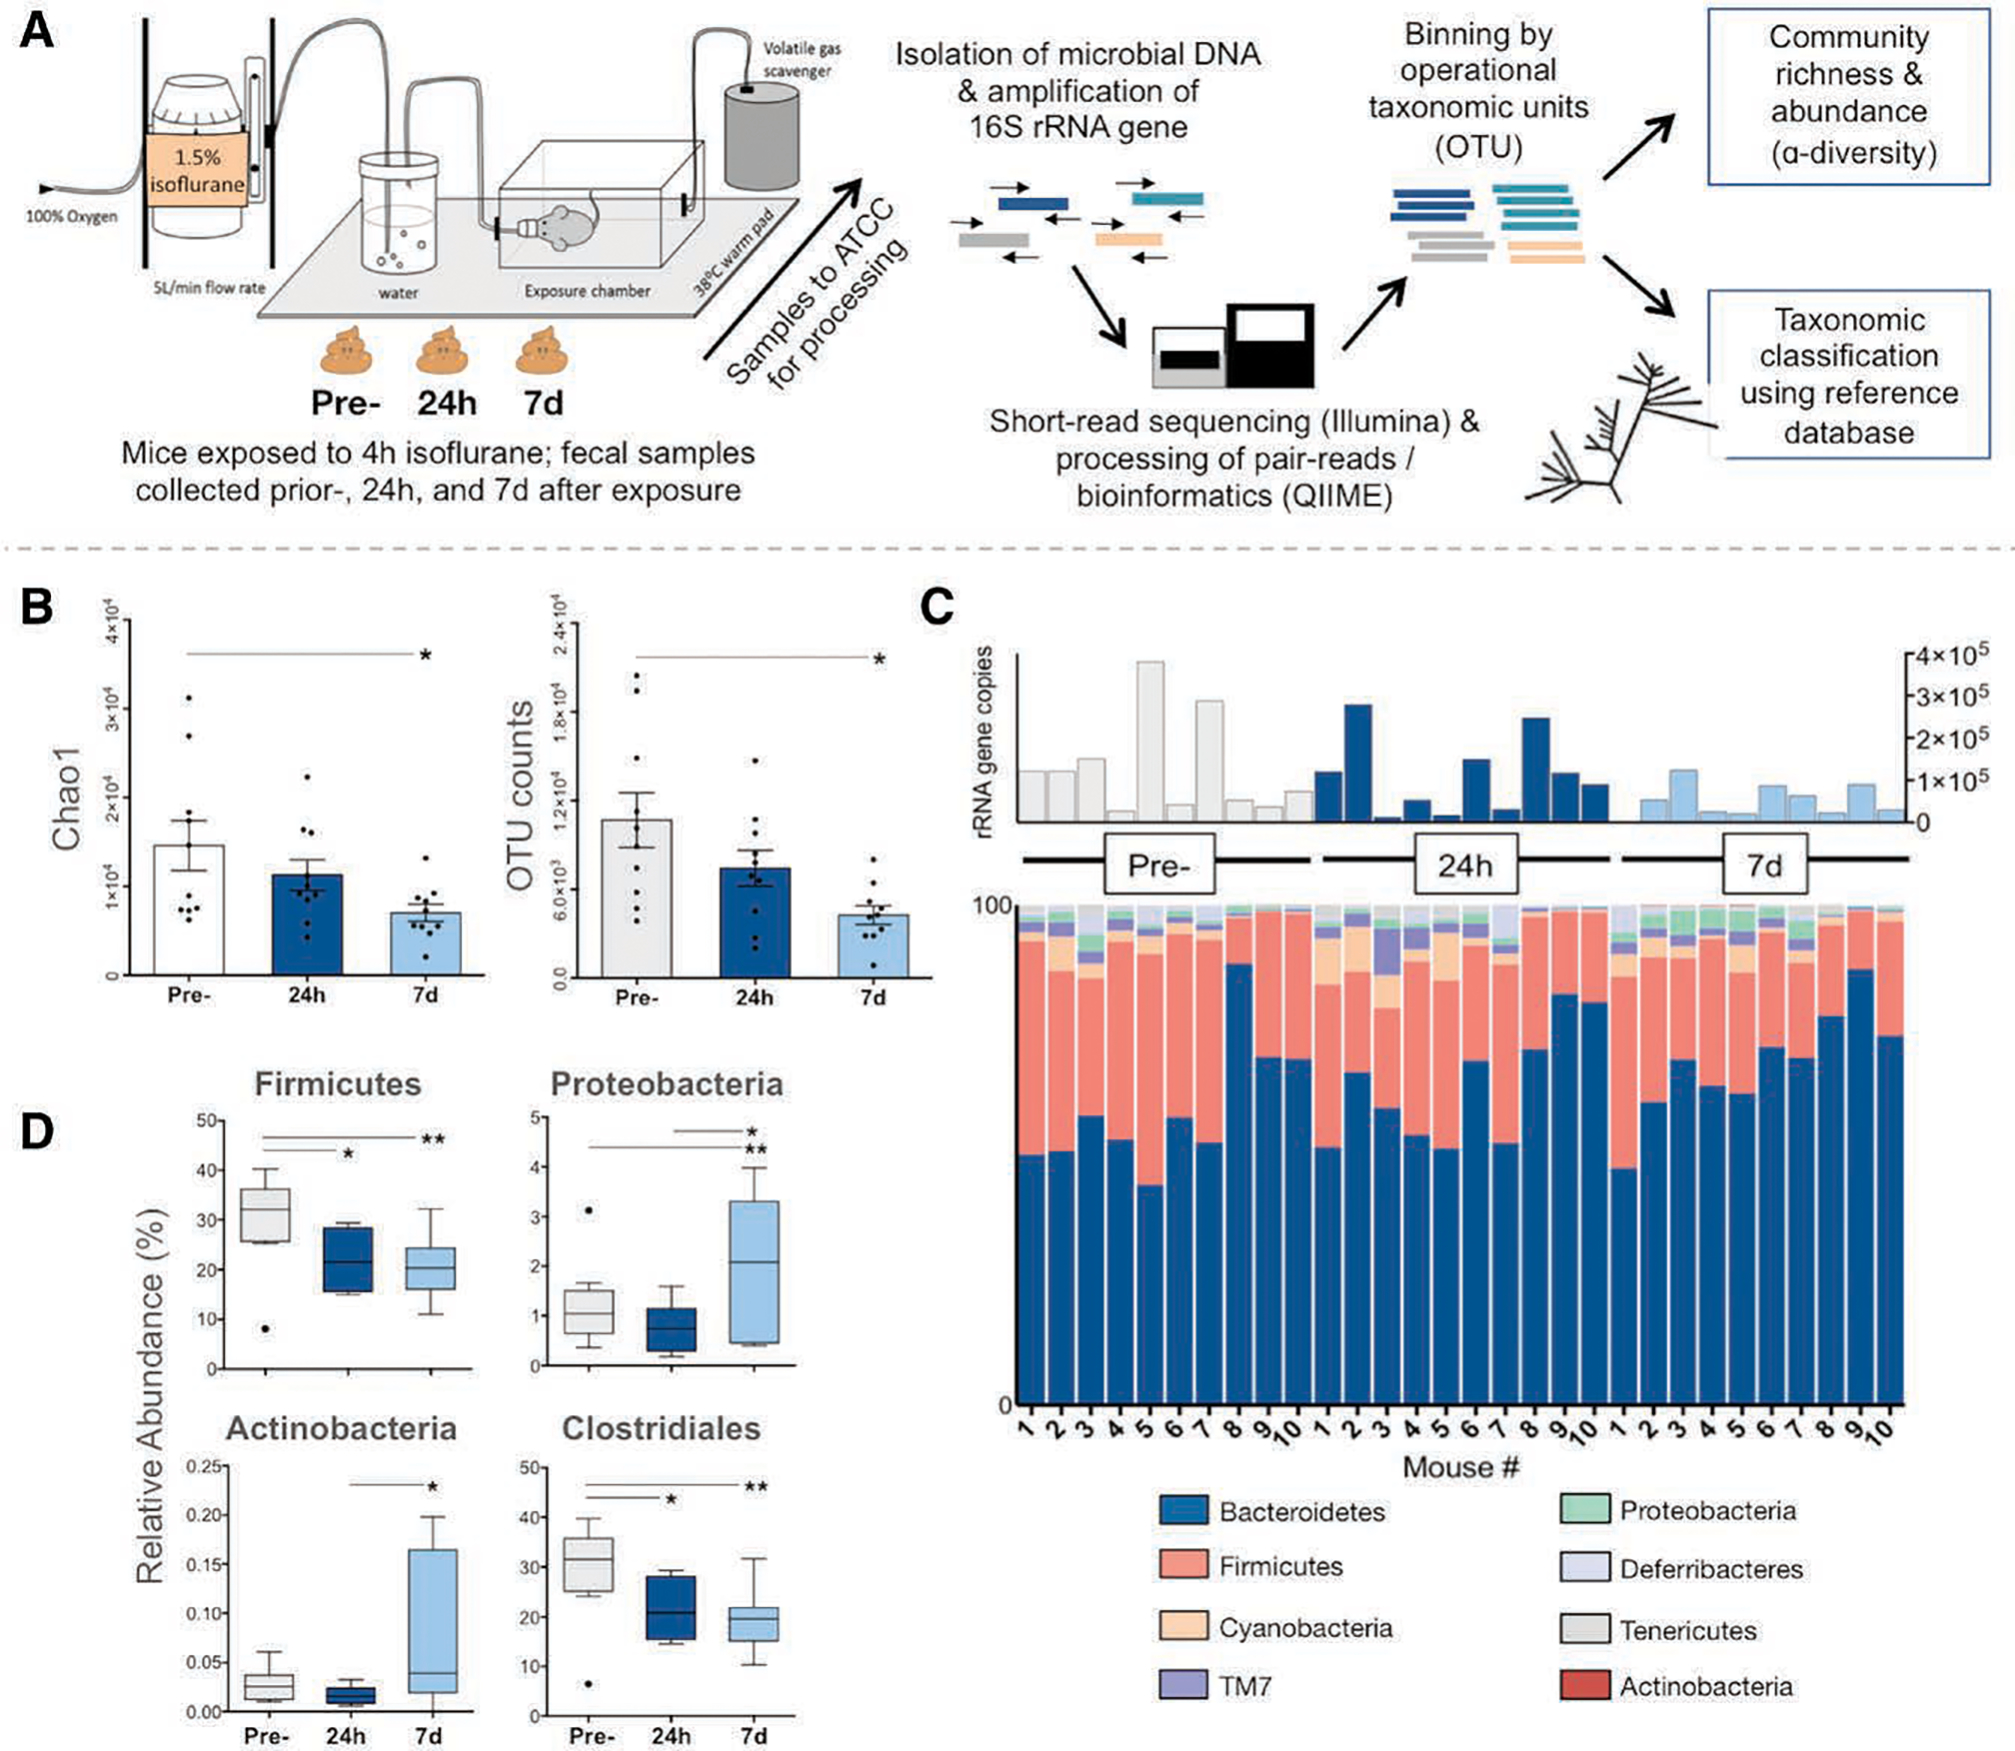
Changes in the mouse gut microbiota after exposure to isoflurane. A, Experiment workflow: fecal samples were collected from mice at 3 time points. Samples were sent to ATCC for processing where DNA was extracted. PCR primers complementary to the V3 and V4 conserved regions of the 16S ribosomal RNA gene were used to amplify the intervening variable sequence using an Illumina (San Diego, CA) platform. Output sequences were then analyzed using the QIIME software package/pipeline.17 After a preprocessing step (primers and low-quality reads trimmed), reads were binned into observed clustered sequences (OTUs). Taxonomy was assigned using the 16S rRNA gene database Greengenes (http://greengenes.lbl.gov) and OTU tables were used for alpha diversity calculations. B–D, Samples were collected at 3 time points: before isoflurane exposure (pre-), and 24 hours and 7 days after (n = 10 mice). Repeated measures 1-way ANOVA was used to compare data from each animal across time points (within-subject effect), and multiple comparisons (comparisons—pre- versus 24 hours, pre- versus 7 days, and 24 hours versus 7 days) were adjusted for by Bonferroni post hoc analysis. Multiplicity-adjusted P values are reported (* = adjusted P < .05 and ** = adjusted P < .01); graphs show mean ± SEM. B, Alpha diversity, as measured by Chao1 scores estimating the predicted number of taxa accounting for rare organisms (left) and OTU count (right), is significantly reduced at 7 days following general anesthesia compared to preexposure (pre- versus 7 days adjusted P = .015 for Chao1 and adjusted P = .043 for OTUs). C, Stacked column graph showing relative abundance of bacterial species in the mouse gut microbiota at the phyla level. Total 16S ribosomal RNA gene copies per sample displayed above. D, Boxplots showing significant changes in relative abundances of taxa. Compared to preexposure, there is a decreased abundance of Firmicutes at 24 hours and 7 days following general anesthesia (pre- versus 24 hours adjusted P = .028; pre- versus 7 days adjusted P = .006), largely due to the decrease in taxa from the Clostridiales order (pre- versus 24 hours adjusted P = .036; pre- versus 7 days adjusted P = .004), whereas abundance of Proteobacteria has increased compared to preexposure (pre- versus 7 days adjusted P = .0293). Boxplots indicate median with edges at 25th and 75th percentiles, and whiskers determined by the Tukey method. ATCC indicates American Type Culture Collection; Chao1, predicted number of taxa after accounting for rare organisms; OTUs, operational taxonomic units; PCR, polymerase chain reaction.
