Fig. 1.
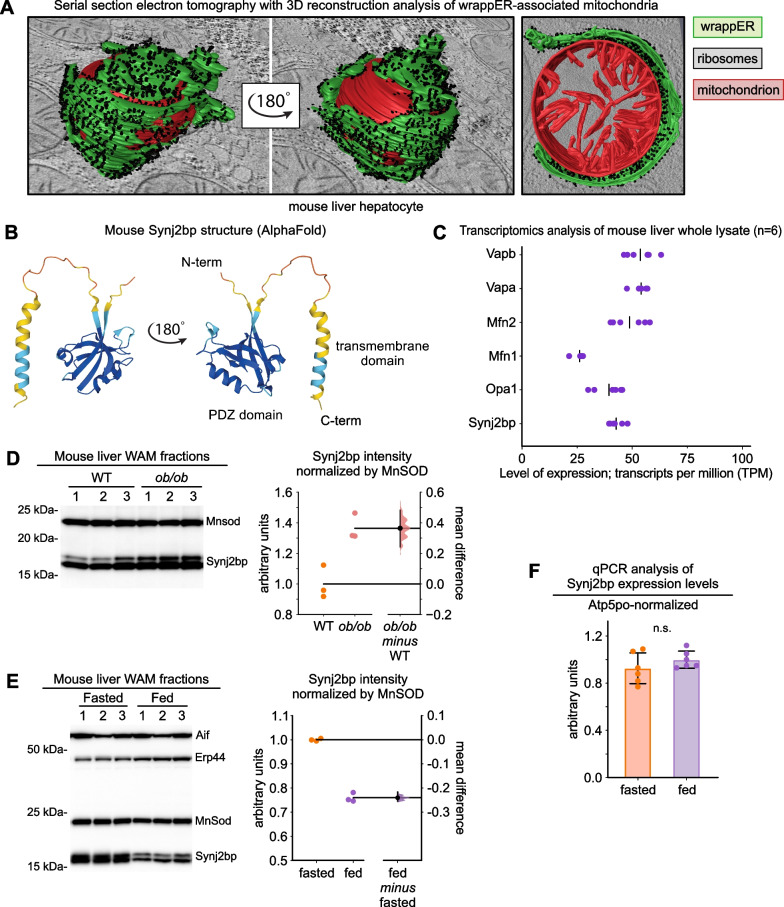
Synj2bp expression level in the liver is dynamic and shifts in response to changes in nutritional status and obesity. A Representative image of a wrappER-associated mitochondria (WAM) found in mouse liver hepatocytes. These images were obtained from serial section electron tomography and 3D reconstruction analysis [1]. B AlphaFold-predicted 3D structure of mouse Synj2bp. C Transcriptomic analysis of mouse liver showing the expression level of genes whose products participate in intermembrane tethering (data collected from [1]). D, E Anti-Synj2bp immunoblot and densitometry analyses (data analyzed by estimation statistics [24, 25]). F Synj2bp expression level in the liver of fasted (14 h) and fed (3 h postprandial) mice measured by quantitative real-time PCR analysis (p value calculated with Mann–Whitney test)

