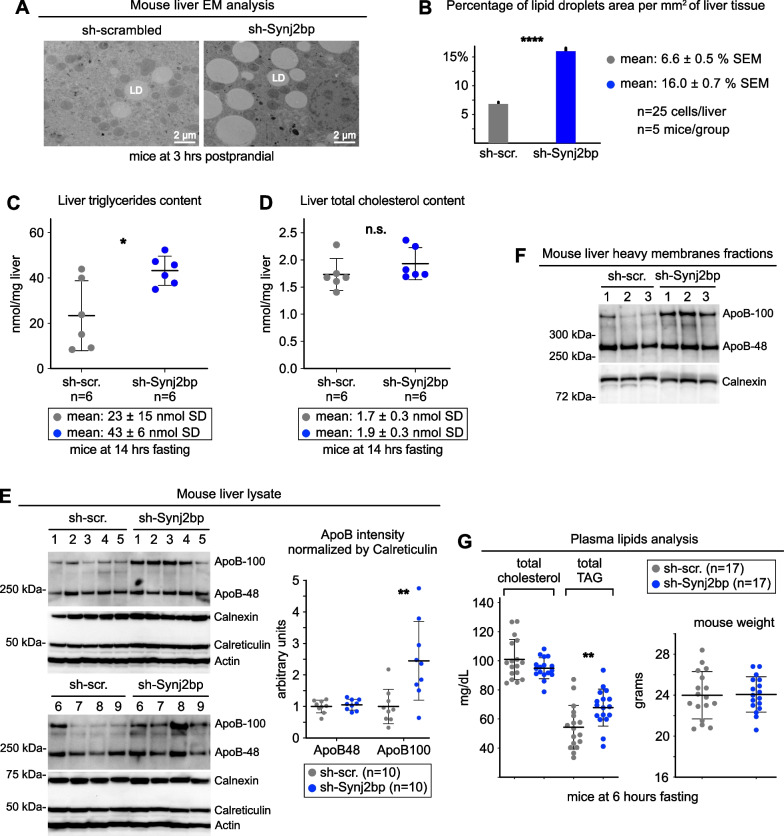
Fig. 3.
Synj2bp silencing in mouse liver increases hepatic and plasma triglycerides content. A, B Quantitative EM morphometric analyses of lipid droplets (LD) in control and Synj2bp-silenced livers (p values calculated with Student’s t test). C, D Lipid content analysis in control and Synj2bp-silenced livers. E, F Immunoblot and densitometry analysis showing changes in ApoB expression in Synj2bp-silenced livers. G Changes in lipid content in the plasma of mice injected with control (AAV8-shScrambled) and Synj2bp-silencing vectors (AAV8-shSynj2bp). The right panel shows the weight of the mice that were used for this analysis. Mann–Whitney test was used to calculate p values unless otherwise indicated

