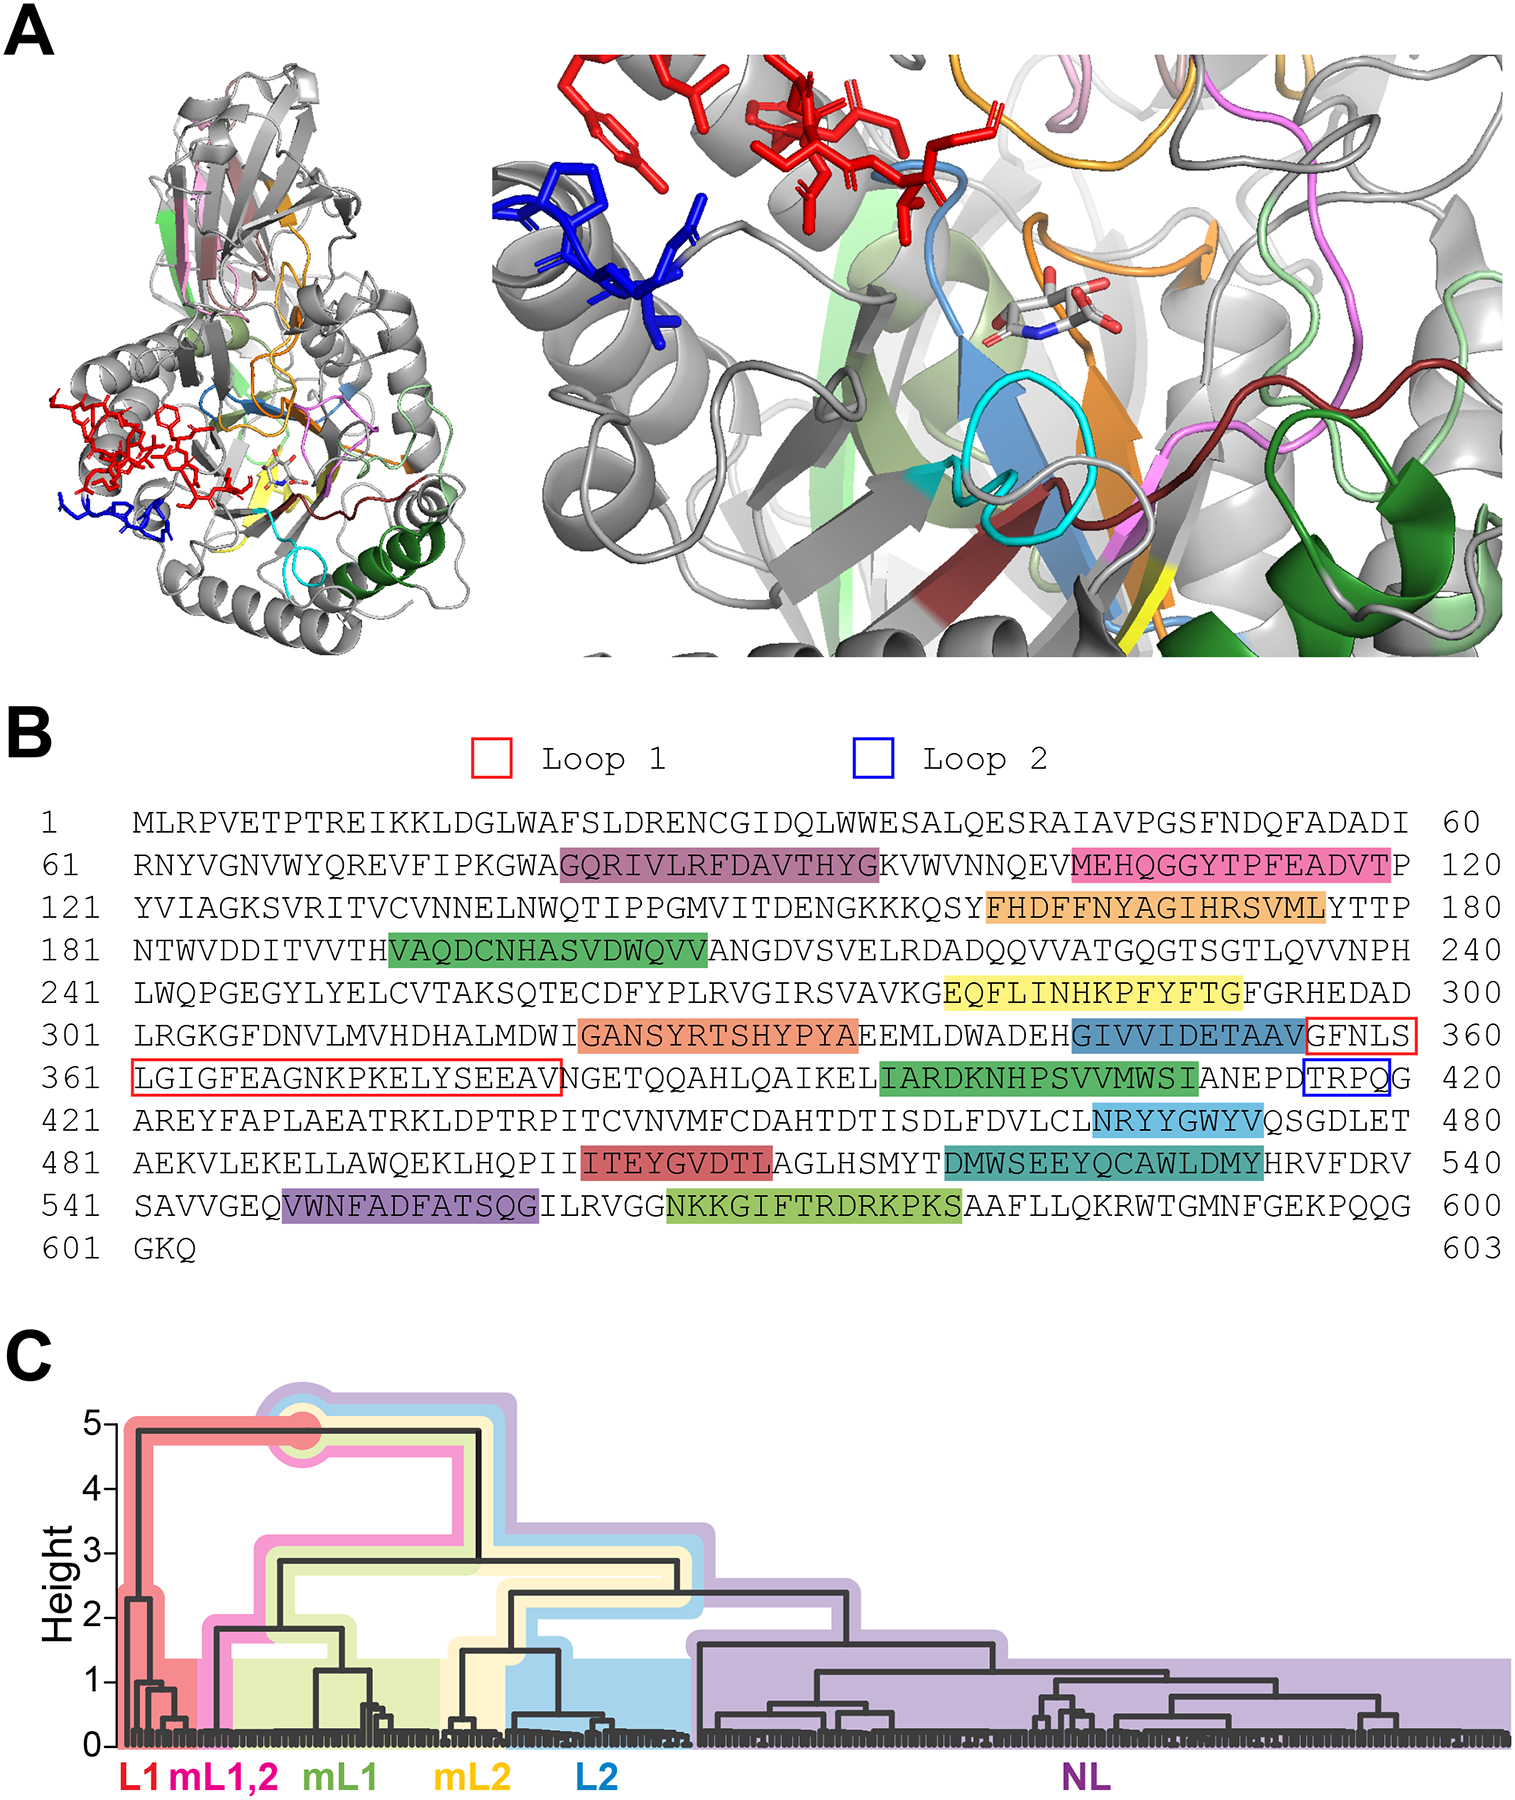
Figure 2. Structure and sequence homology of GUS enzymes.

(A) Structure of E. coli GUS with an inhibitor, glucaro-D-lactam. This protein formed a homotetramer in the original X-ray crystal structure (PDB: 3K4D). A monomer is selected to illustrate the tertiary structure of this protein (left) and its active site (right). The parts illustrated as red and blue sticks represent the Loop 1 and Loop 2 regions, respectively. E. coli GUS belongs to the L1 subgroup and its Loop 1 region is proximate to the inhibitor molecule. Other colored parts in cartoon mode have ≥ 90% sequence identity among GUS homologs from a modified version of the HMGC279 GUS data set curated from the Human Microbiome Project (HMP) Stool Sample Catalog4. Samples in the HMGC279 dataset that were described as fragments or had undetermined taxonomy were removed, resulting in a subset of 229 GUS enzyme amino acid sequences (GUS229) that we used for identifying conserved regions. Many of these conserved regions form the active site and interact with the inhibitor. (B) Amino acid sequence of E. coli GUS. Highlighted regions of this sequence (SRS017191.56930) correspond to the conserved motifs colorized in Figure 1A. Loop region sequences are outlined (Loop 1, blue; Loop 2, red). (C) Hierarchical clustering dendrogram of GUS homologs from the GUS229 dataset. Inter-motif regions containing Loop 1 and Loop 2 (from GUS229) were each aligned in UGENE (v41.0)99 using MUSCLE (with default parameters). A sequence identity distance matrix for the GUS229 alignment was calculated in R (v4.1.2) using the R package seqinr (v4.2–8) to evaluate sequence identity, and a custom Python (v3.9) script to weigh the length of the two loop regions. The aggregate distance matrix was used for agglomerative hierarchical clustering (“mcquitty” method) in R. Loop subgroups are distinguished by color as indicated on the dendrogram. Homologs from the same subgroup (L1, mL1,2, mL1, mL2, L2, and NL) clearly clustered together.
