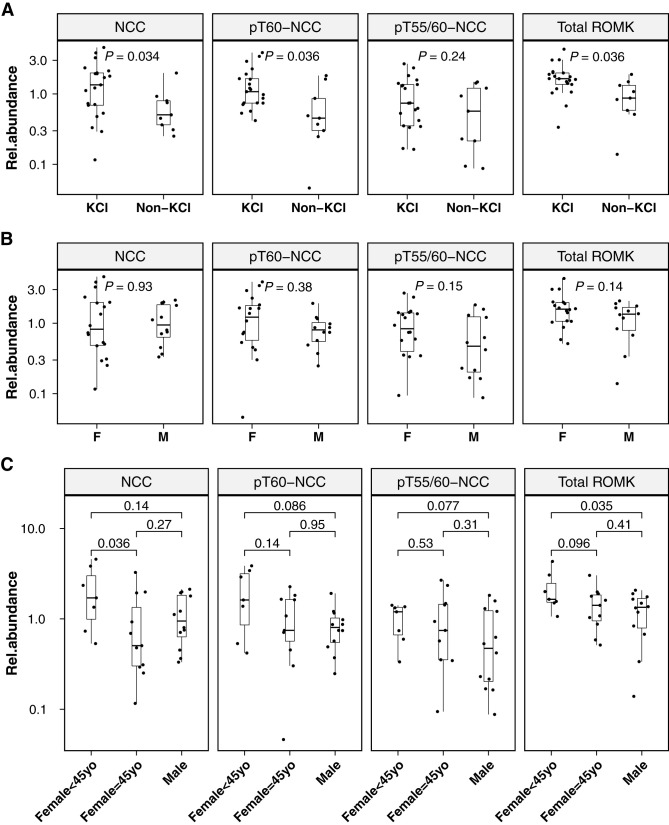
Figure 4.
Baseline uEV protein differences. Baseline differences in uEV levels of analyzed proteins in participants with PA according to allocation of oral KCl supplementation (A) and sex (B and C). KCl, participants in the KCl group; non-KCl, participants in the non-KCl group; F, women; M, men; Female<45yo, women who were <45 years old; Female≥45yo, women who were ≥45 years old; Rel.abundance, relative protein abundance (the ratio of protein absolute abundance to the sum abundance of ALIX, TSG101, and CD9); P values on the basis of unpaired Wilcoxon test.

