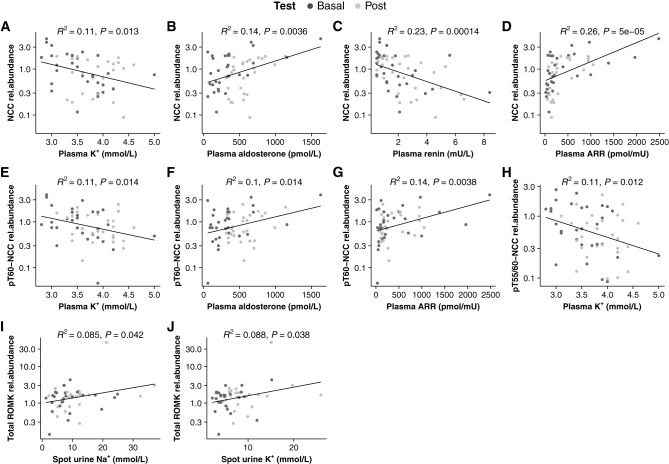
Figure 6.
Notable correlations among all participants with PA during the test. Basal, baseline values (colored in dark gray), biochemical parameter measured at 7:00am on day 0 in a recumbent posture; Post, post-test values (colored in silver), biochemical parameter measured at 8:00am on day 1 during a seated posture; rel.ab, relative protein abundance (the ratio of protein absolute abundance to the sum abundance of ALIX, TSG101, and CD9).

