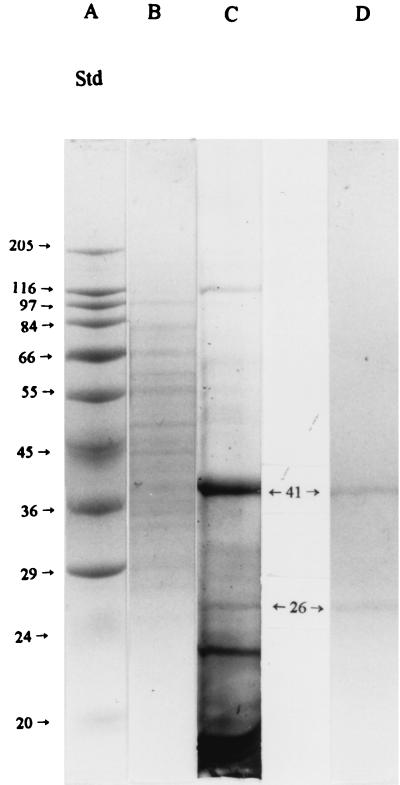
FIG. 4.
Typical SDS-PAGE profile of proteins in crude mucus extract (lane B), proteins eluted from the affinity column with buffer C (pH 2.5 glycine buffer) after washing with binding buffer (low concentration of salt and no detergent) (lane C), and proteins eluted from affinity column with buffer C after washing with washing buffers A (pH 7.2 buffer plus 2 M NaCl plus 1% Tween 20) and B (pH 7.2 buffer plus 1 M NaCl) (lane D). Lane A shows the elution profile of the standard (Std) molecular mass markers, with the corresponding molecular masses (kilodaltons) indicated to the left. There were approximately 19 bands in lane B, 19 in lane C (five of which [17, 21, 26, 41, and 116 kDa] were more predominant than others), and two in lane D (26 and 41 kDa). The concentrations of protein in the samples applied to lanes B, C, and D were 2,000, 2,000, and 300 μg/ml, with the volume being 10 μl. Samples for lanes B and C were from the some preparation, and those for lane D were from a different preparation. See Materials and Methods for further details.

