
Figure 7: Imaging mass cytometry of preretinal diabetic retinal neovascularization membranes compared to premacular membranes in macular pucker (non-diabetic).
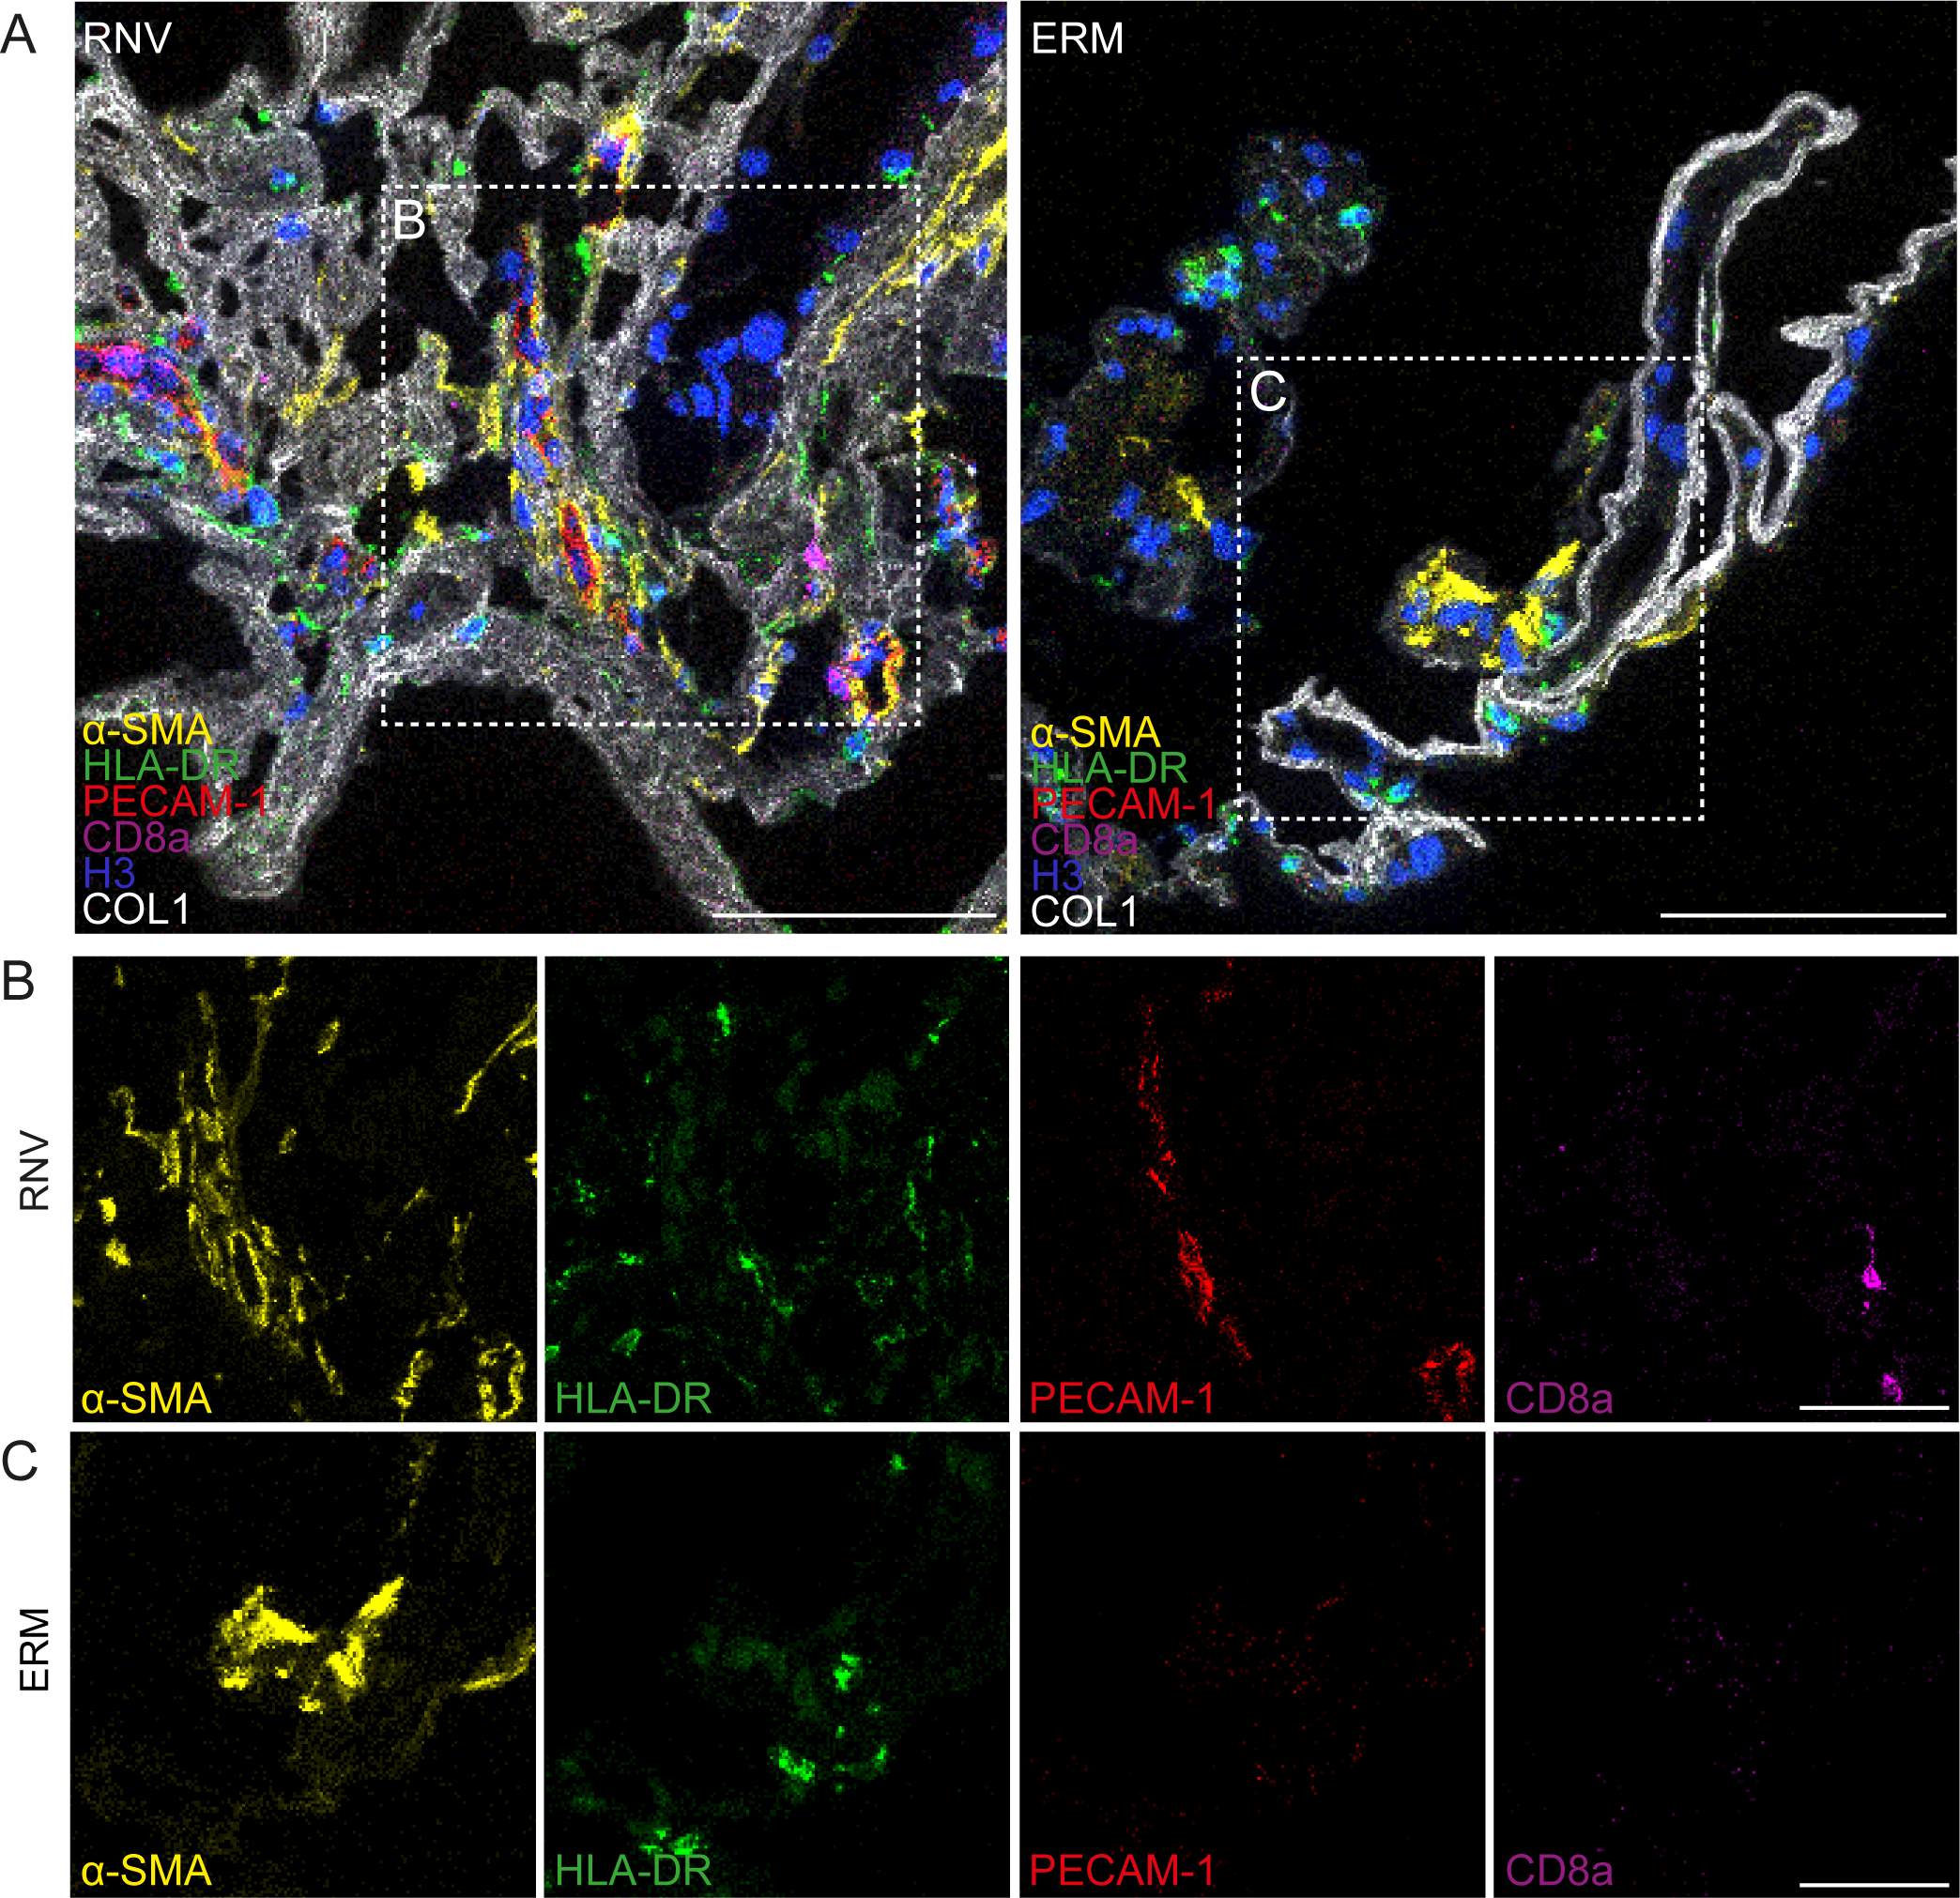
Imaging mass cytometry of human retinal neovascularization (“RNV”) and macular pucker (“ERM”) tissue samples from humans. Multiplexed stainings for α-SMA (α-smooth muscle actin, yellow), HLA-DR (human leukocyte antigen – DR isotype, green), PECAM-1 (platelet endothelial cell adhesion molecule, red), CD8a (cluster of differentiation 8a, magenta), Histone H3 (blue) and COL1 (collagen type I, white) are presented. Higher magnification of the sections within the dashed white squares are shown in the panels in B and C, respectively. Scale bars correspond to 100 μm (A) and 50 μm (B and C). Reproduced from [89], licensed under CC-BY4.0 (http://creativecommons.org/licenses/by/4.0/)