
Fig. 2.
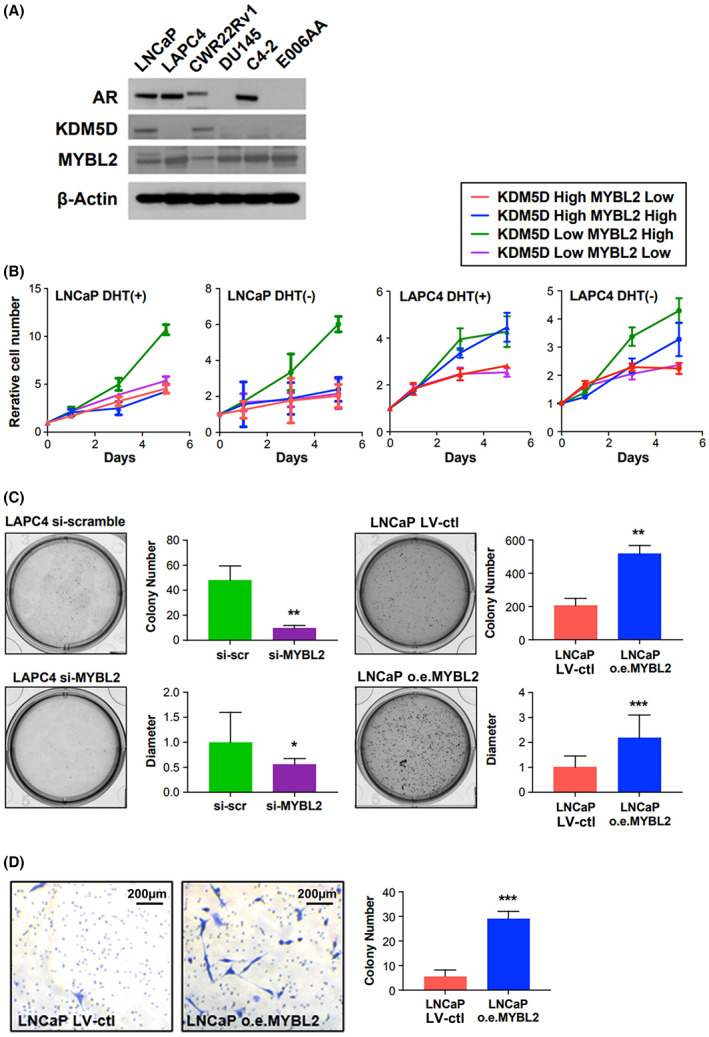
KDM5D‐low/MYBL2‐high promotes CRPC in this figure, all experiments were performed 3 times. AR, androgen receptor; CSS, charcoal‐stripped serum; ctl, control; DHT, dihydrotestosterone; LV, lentivirus; o.e., overexpression; scr, scramble. (A) Androgen receptor, KDM5D, and MYBL2 protein levels by western blot analysis of six prostate cancer cell lines. (B) Cell proliferation assay of indicated cell lines in CSS media with and without DHT. Error bars indicate standard deviation. LNCaP: KDM5D‐high/MYBL2‐low: si‐control/Lenti‐control; LNCaP: KDM5D‐high/MYBL2‐high: si‐KDM5D scramble/Lenti‐MYBL2; LNCaP: KDM5D‐low/MYBL2‐high: si KDM5D/Lenti‐MYBL2; LNCaP: KDM5D‐low/MYBL2‐low: si‐KDM5D/Lenti‐control; LAPC4: KDM5D‐high/MYBL2‐low: o.e.KDM5D + si‐MYBL2; LAPC4: KDM5D‐high/MYBL2‐high o.e.KDM5D + si‐control; LAPC4: KDM5D low/MYBL2‐high: Lenti‐control + si‐control; LAPC4: KDM5D low/MYBL2 low: Lenti‐control +si‐MYBL2. (C) Soft‐agar colony formation assay in LAPC4 si‐control, si‐MYBL2, LNCaP si‐control, and overexpression MYBL2. Representative images are shown after 14 days. The measured number of colonies and the measured diameter of the colony are represented in bar graphs. Error bars indicate standard deviation (t‐test; * indicates P < 0.05; **, P < 0.01; ***, P < 0.001). (D) Matrigel invasion assay in LNCaP lenti‐control, and overexpression MYBL2. Error bars indicate standard deviation (t‐test; *** indicates P < 0.001). The scale bar is 200 μm.