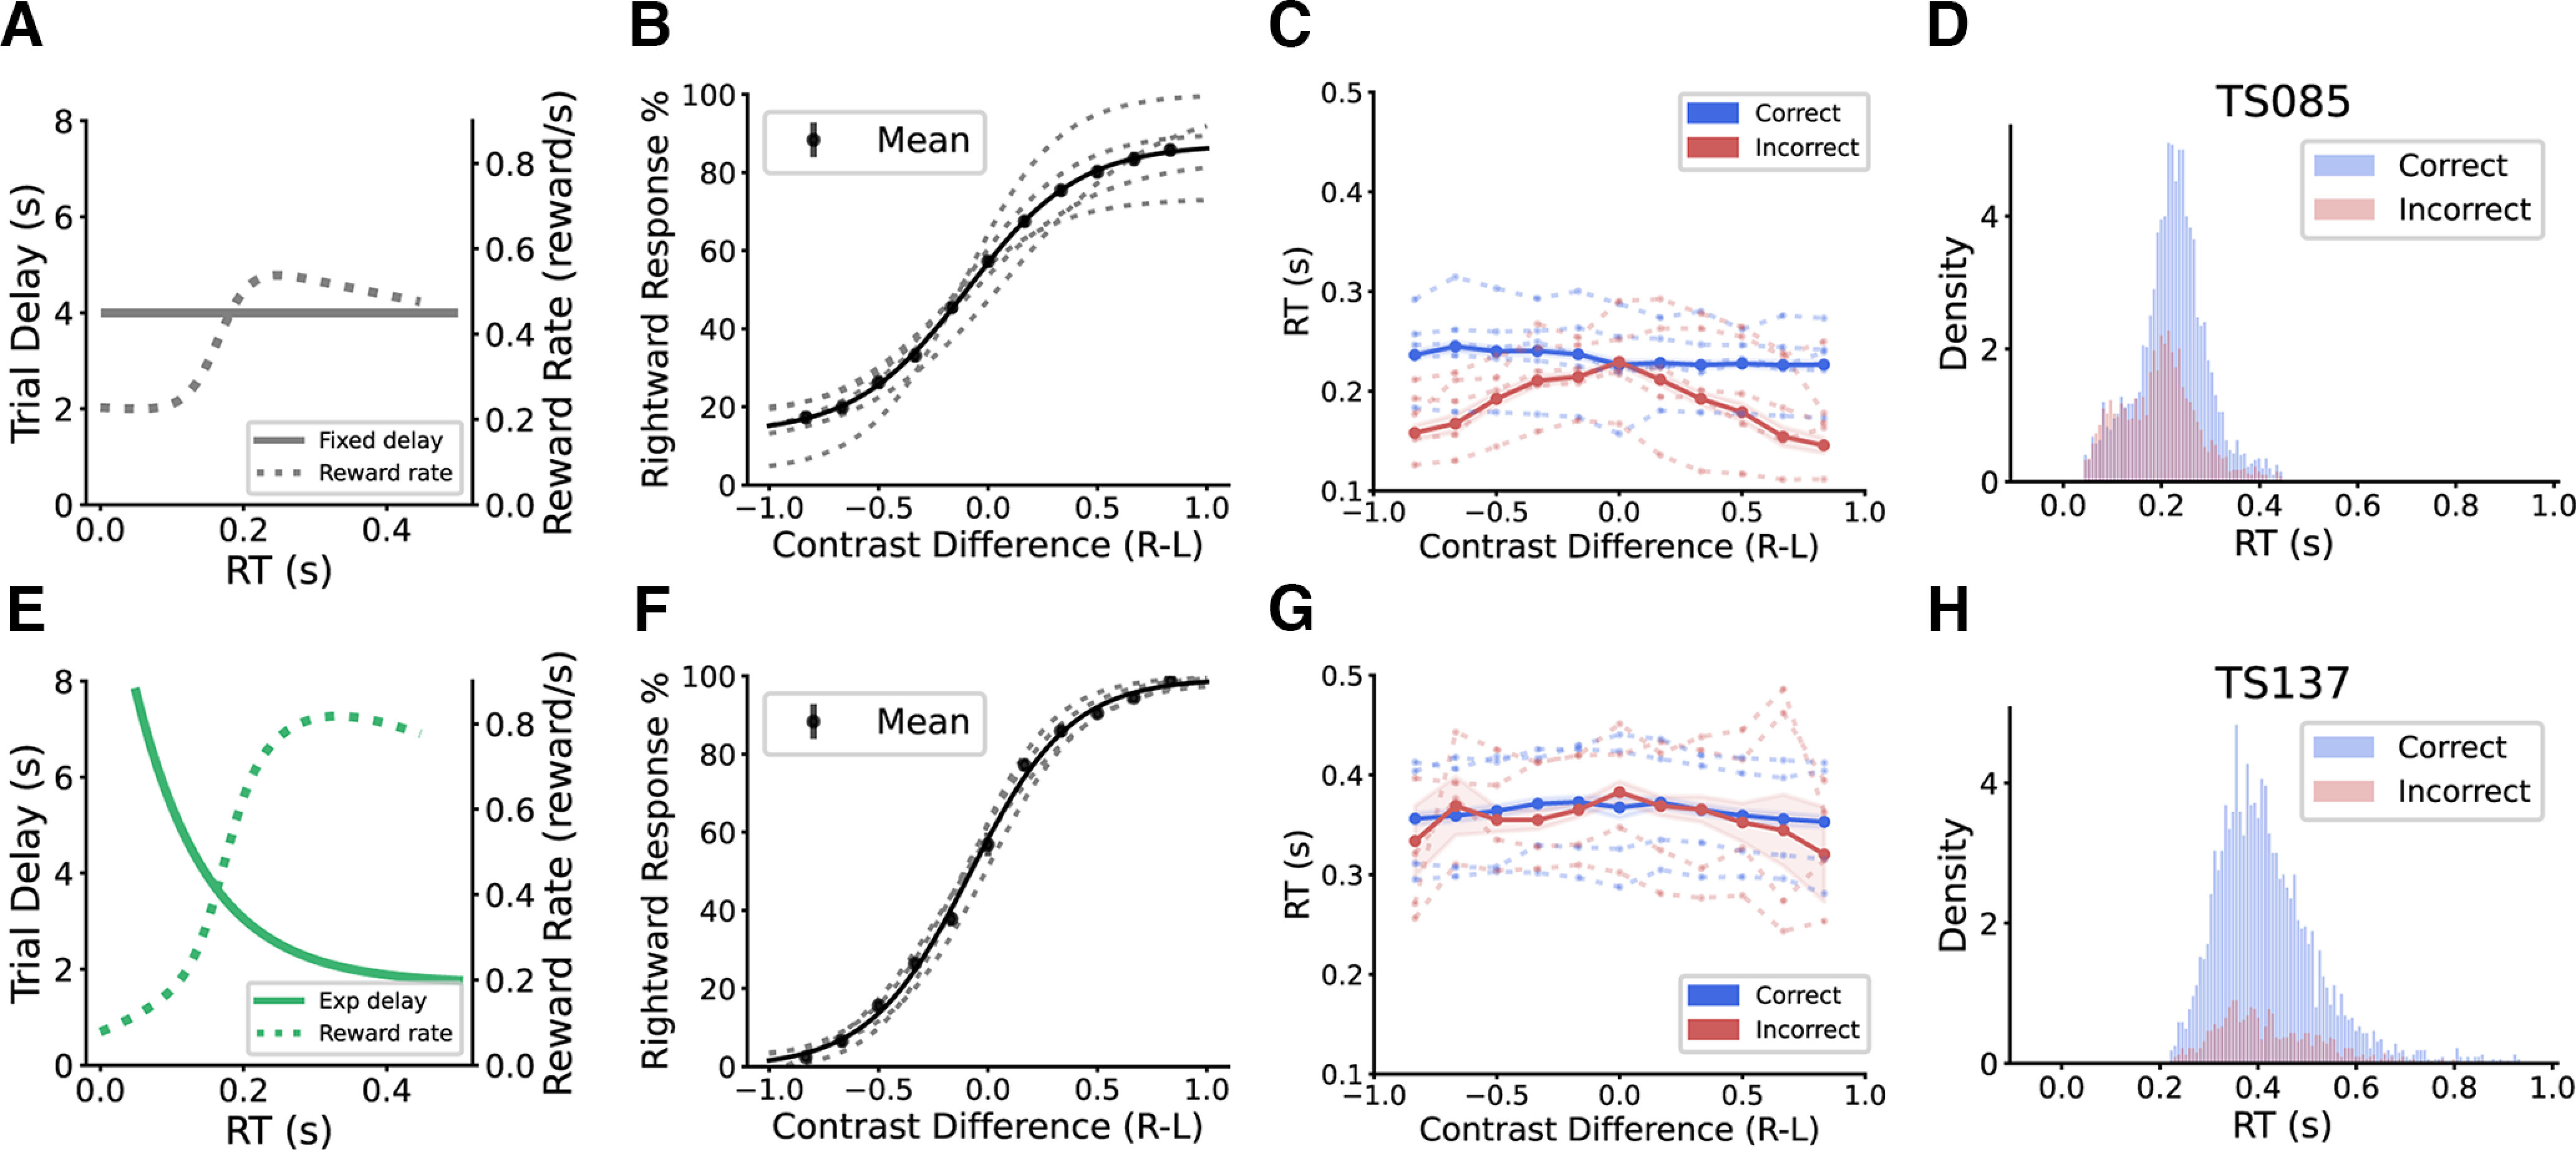
Figure 2.

Tree shrews show different behaviors under two training schemes. A, A fixed delay of 4 s (solid line) was used in training one group of animals. The dashed line shows the theoretical reward rate under this fixed delay. B, Psychometric curve of animals from this training scheme. Contrast difference: right contrast (R) – left contrast (L). Gray dashed line, Individual animals. Black solid line, Average across animals. C, Response time (RT) as a function of contrast difference. Dashed line, Individual animals. Solid line, Average across animals. The shaded area is 95% confidence interval. D, RT density histogram from a representative animal. Correct and incorrect trials are separately plotted. E, An exponential decay delay scheme (solid line) was applied in another group. The dashed line shows the theoretical reward rate under this scheme. F–H, Same as C–E but for the second group. Figures 2-1 and 2-2 show the RT distributions of individual animals from the fixed-delay group and exponential-delay group respectively.
