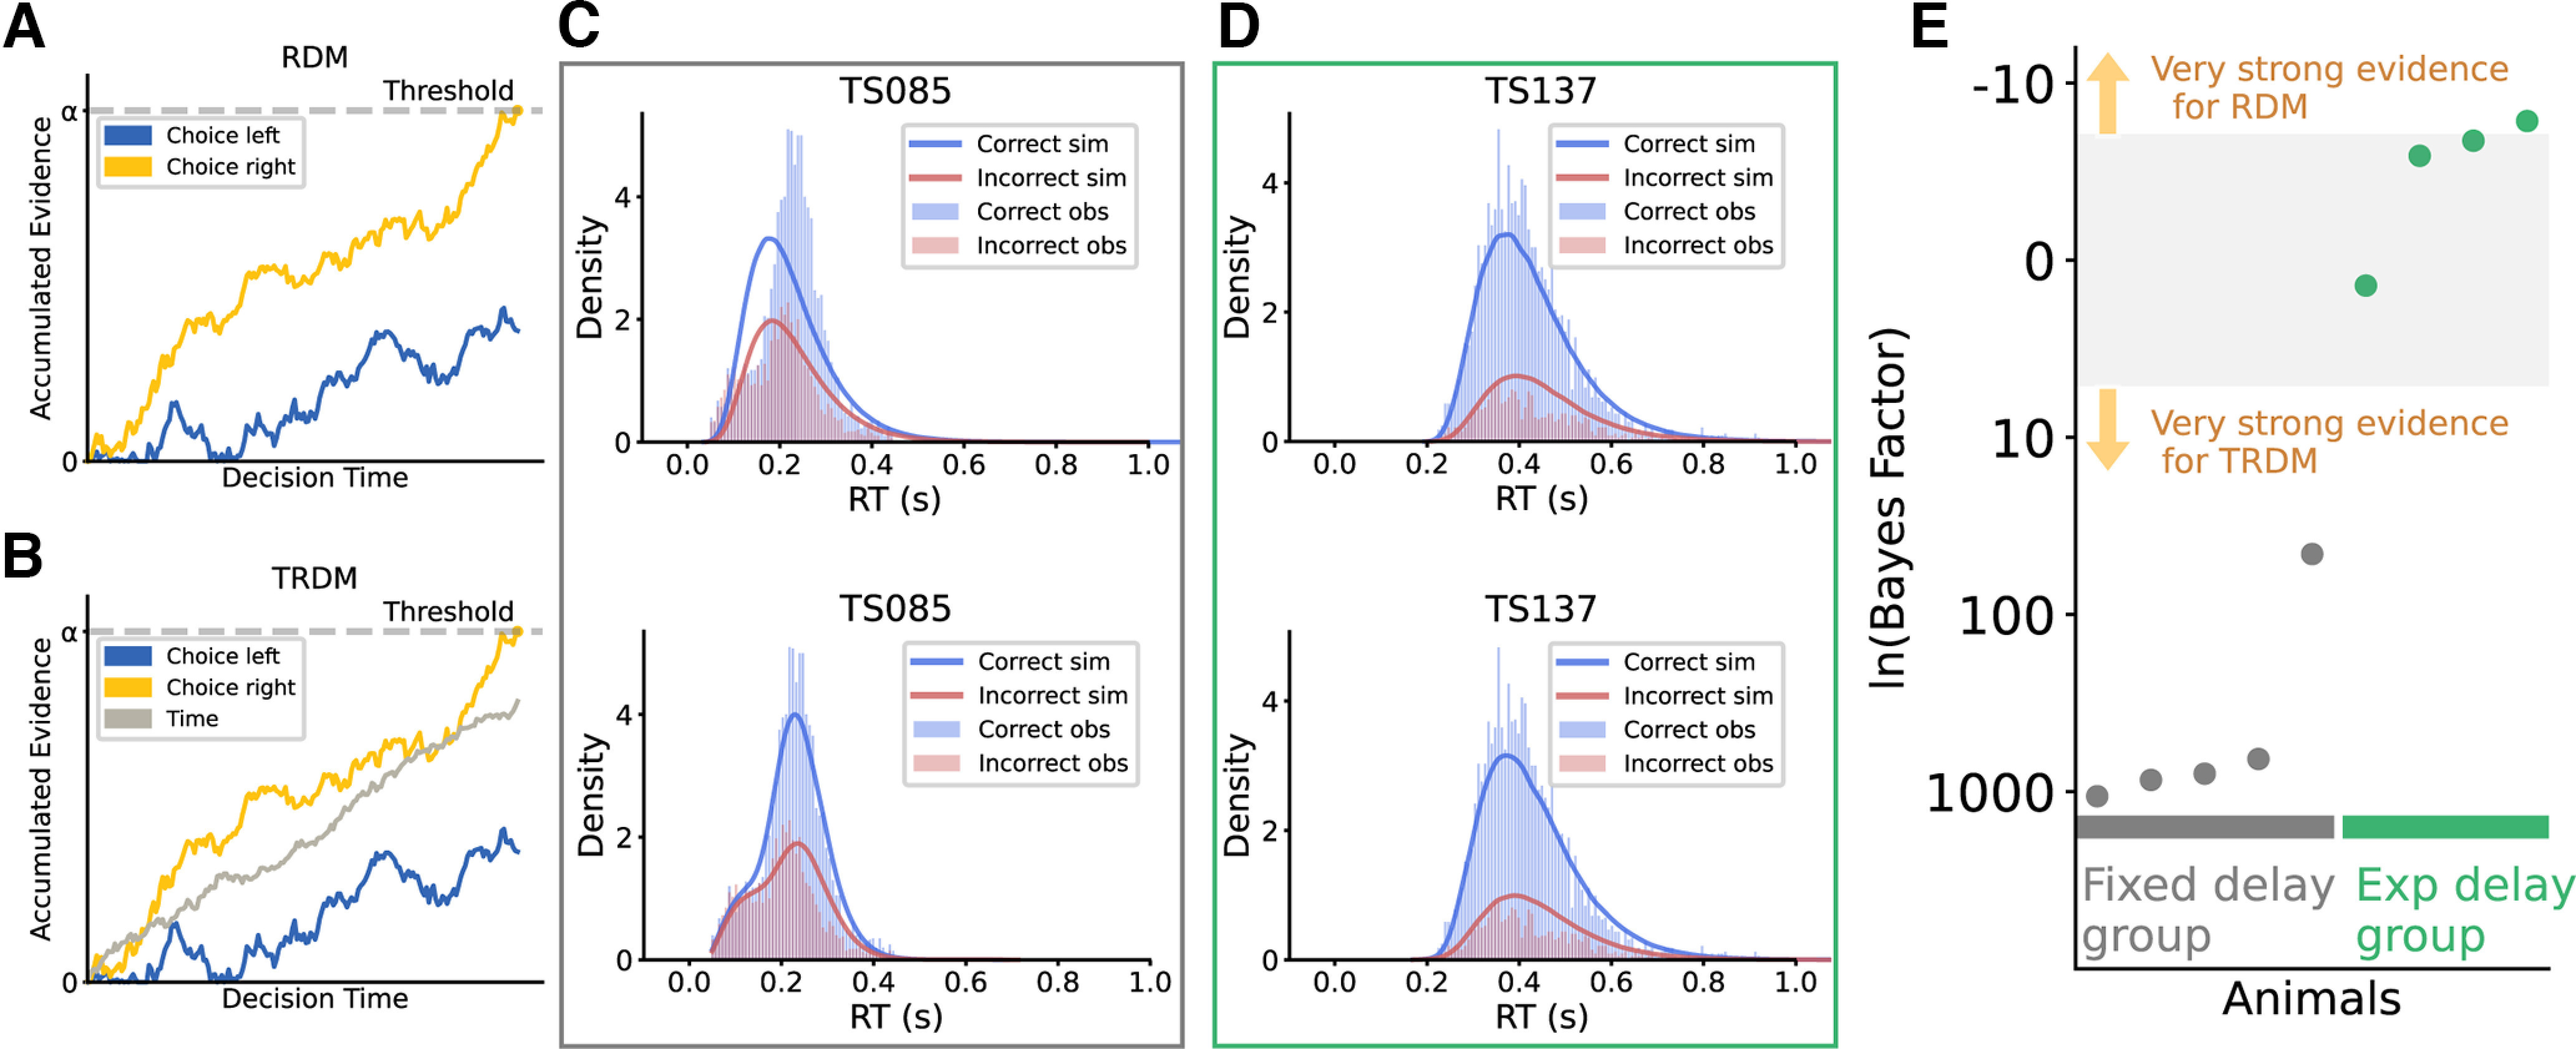
Figure 3.

Modeling results suggest that evidence accumulation combined with a timing mechanism better fits tree shrew decision-making behavior. A, B, Racing diffusion model (RDM; A) and timed racing diffusion model (TRDM; B). Blue trace, The evidence accumulator for left choice. Yellow trace, The evidence accumulator for right choice. Gray trace, The time accumulator. The two evidence accumulation processes race against each other. In these schematics, the accumulator for right stimuli (yellow) reaches the threshold first, resulting in a rightward choice. C, Observed (histograms) and simulated (lines) RT distribution for the representative animal from the fixed-delay group. Top, RDM simulation. Bottom, TRDM simulation. D, Observed and simulated RT distribution for the representative animal from the exponential-delay group. Top, RDM simulation. Bottom, TRDM simulation. E, Estimated log Bayes factor comparing the two models’ performance. Positive values favor TRDM, while negative values favor RDM. Gray dots represent the animals from the fixed-delay training, and green dots represent the exponential-delay group. The upper and lower edges of the gray shaded area represent the lower limit for “very strong” evidence [ln(BF) = 5].
