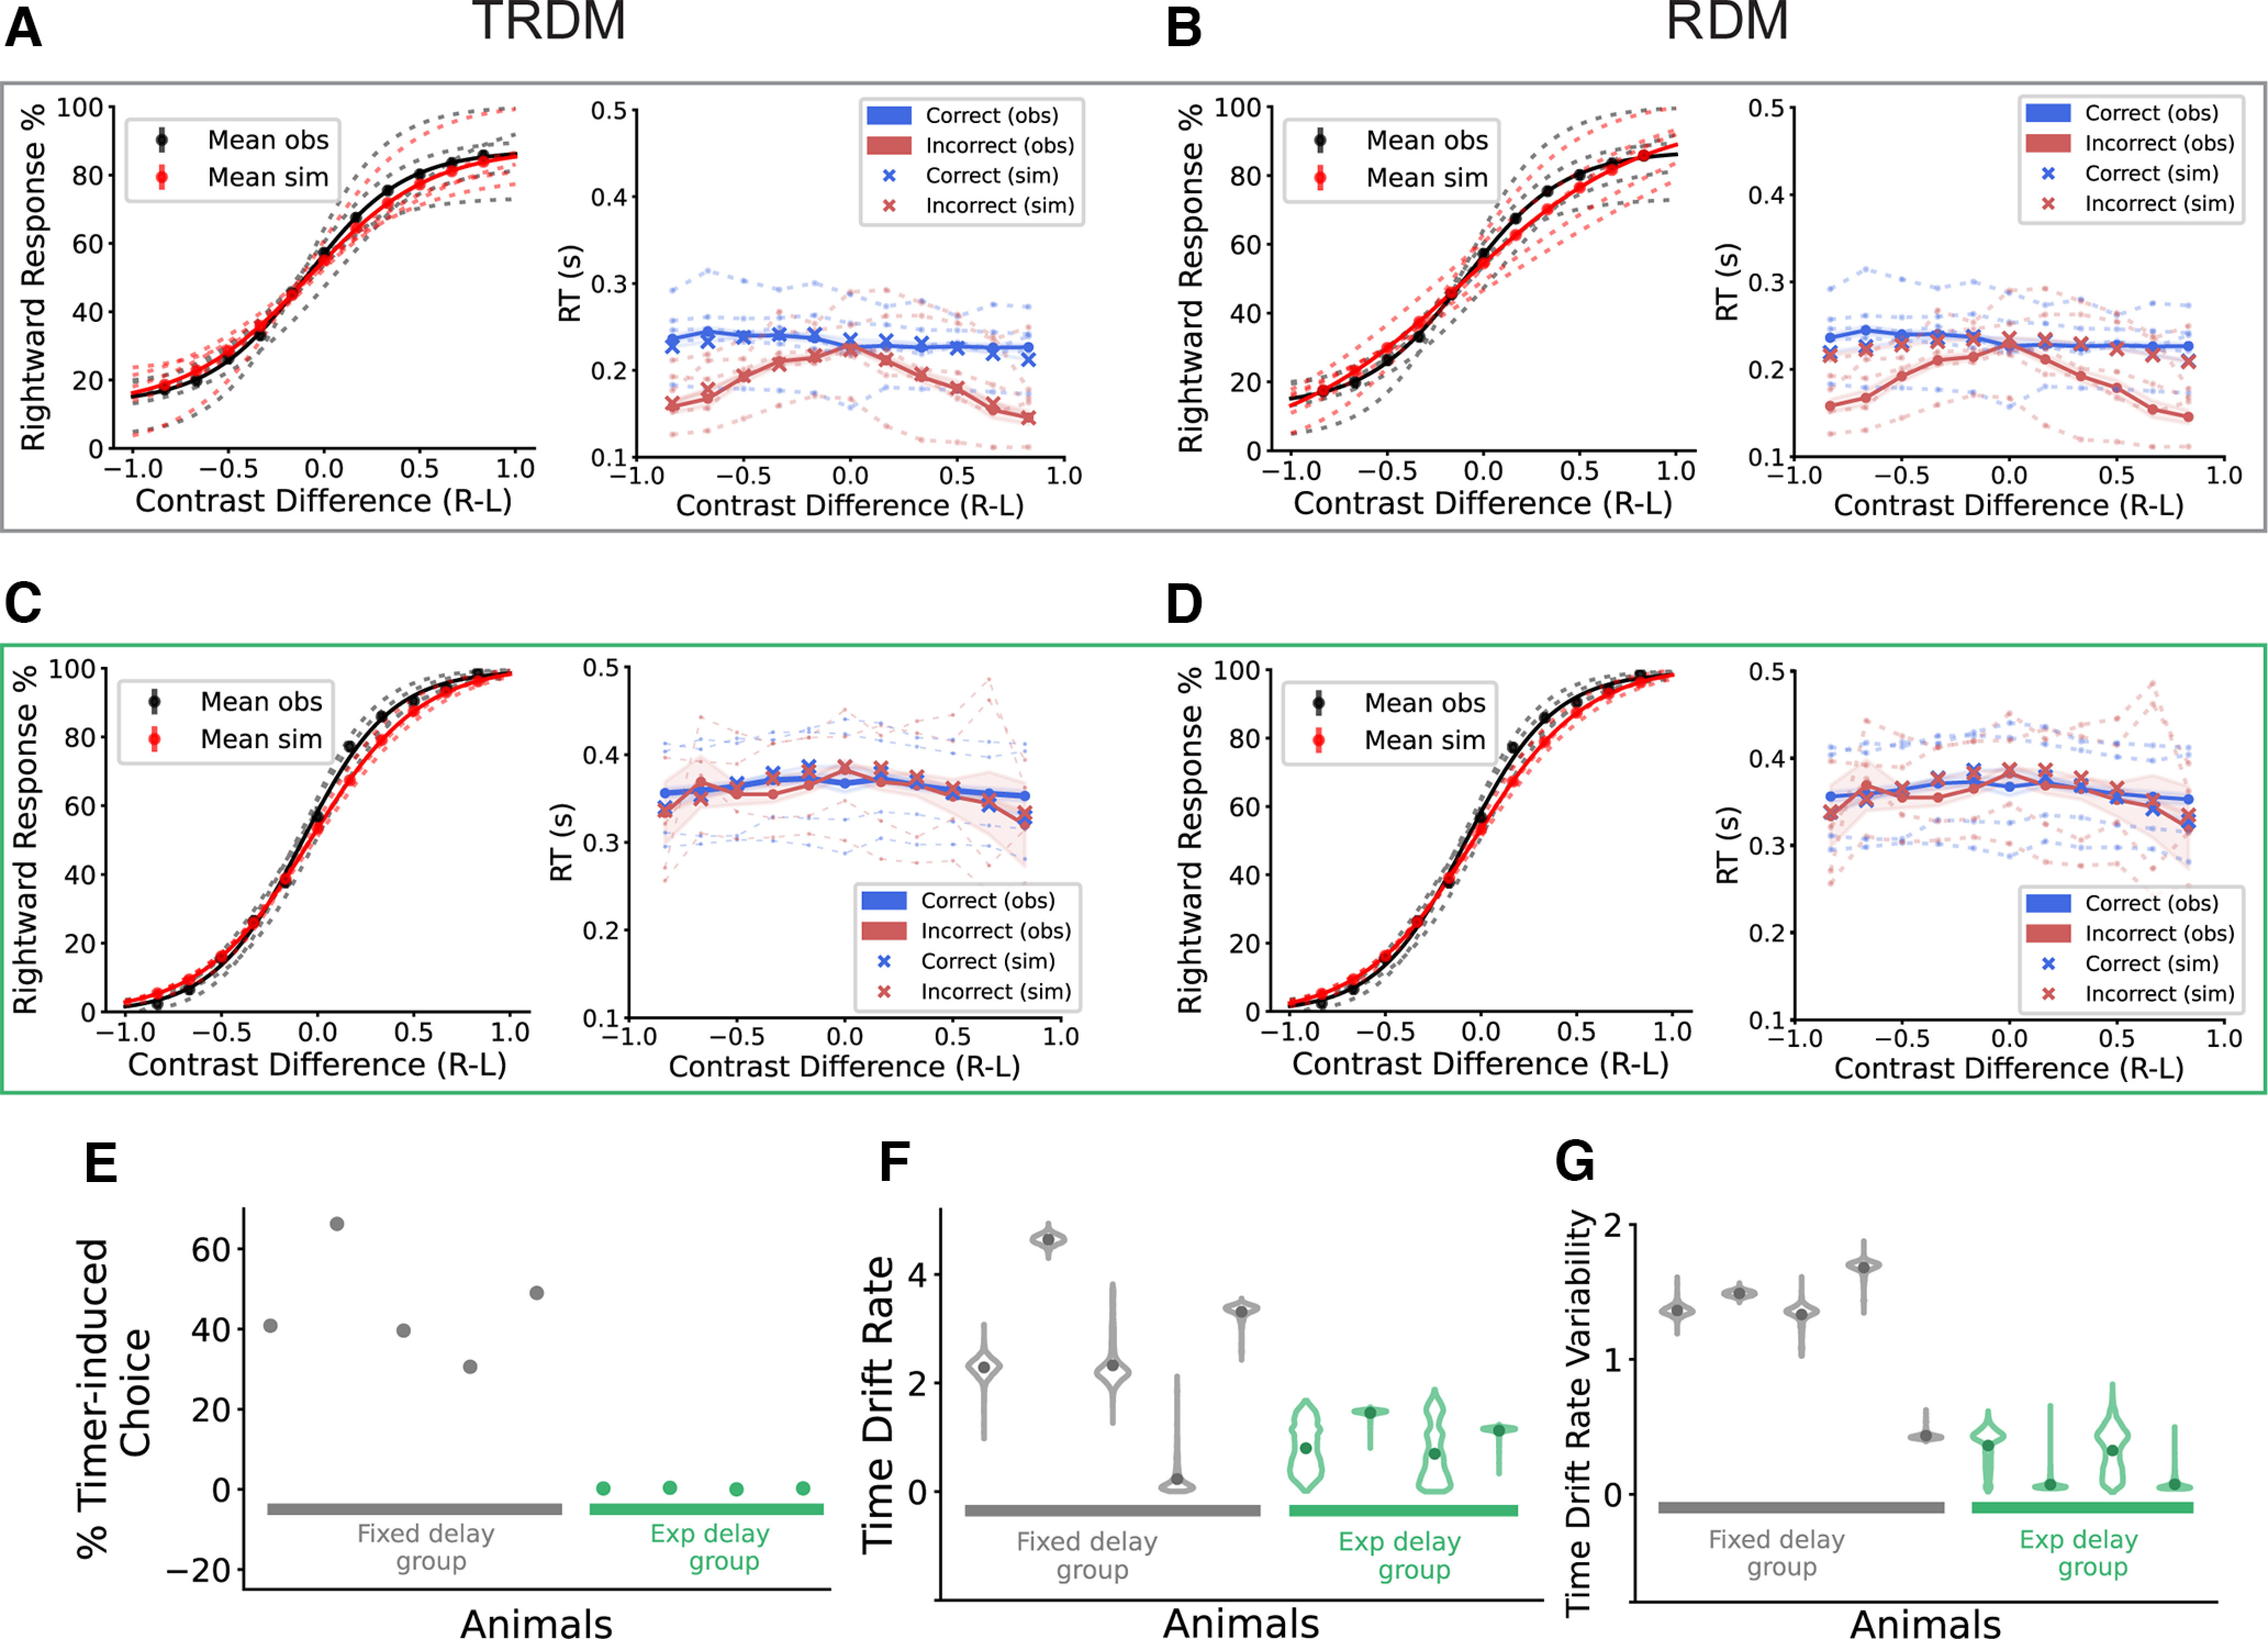
Figure 4.

Model simulation of the psychometric curves and associated response time, and the posterior of the timer-related parameters. A, TRDM simulation for the fixed-delay group. Left, Observed (black) and simulated (red) psychometric curves for individual animals (dotted lines) and the group average (solid lines). The simulations were done with the best fitting parameters of the TRDM. Right, Observed (dots, solid lines, and dotted lines) and simulated RT function (“x”). Dotted lines, Individual animals. Solid lines, Group average. B, RDM simulation for the fixed-delay group. C, TRDM simulation for the exponential-delay group. D, RDM simulation for the exponential-delay group. E, Percentage of timer-induced choice calculated from the TRDM-simulated data for each animal. F, The posterior distribution of the time accumulator mean drift rate (ρt) for individual animals from the TRDM fitting. The dot in each distribution indicates the mean value. G, Same as F, but for the drift rate variability of the time accumulator (ηt). Figure 4-1 shows the decomposed simulation data of TRDM for one example animal.
