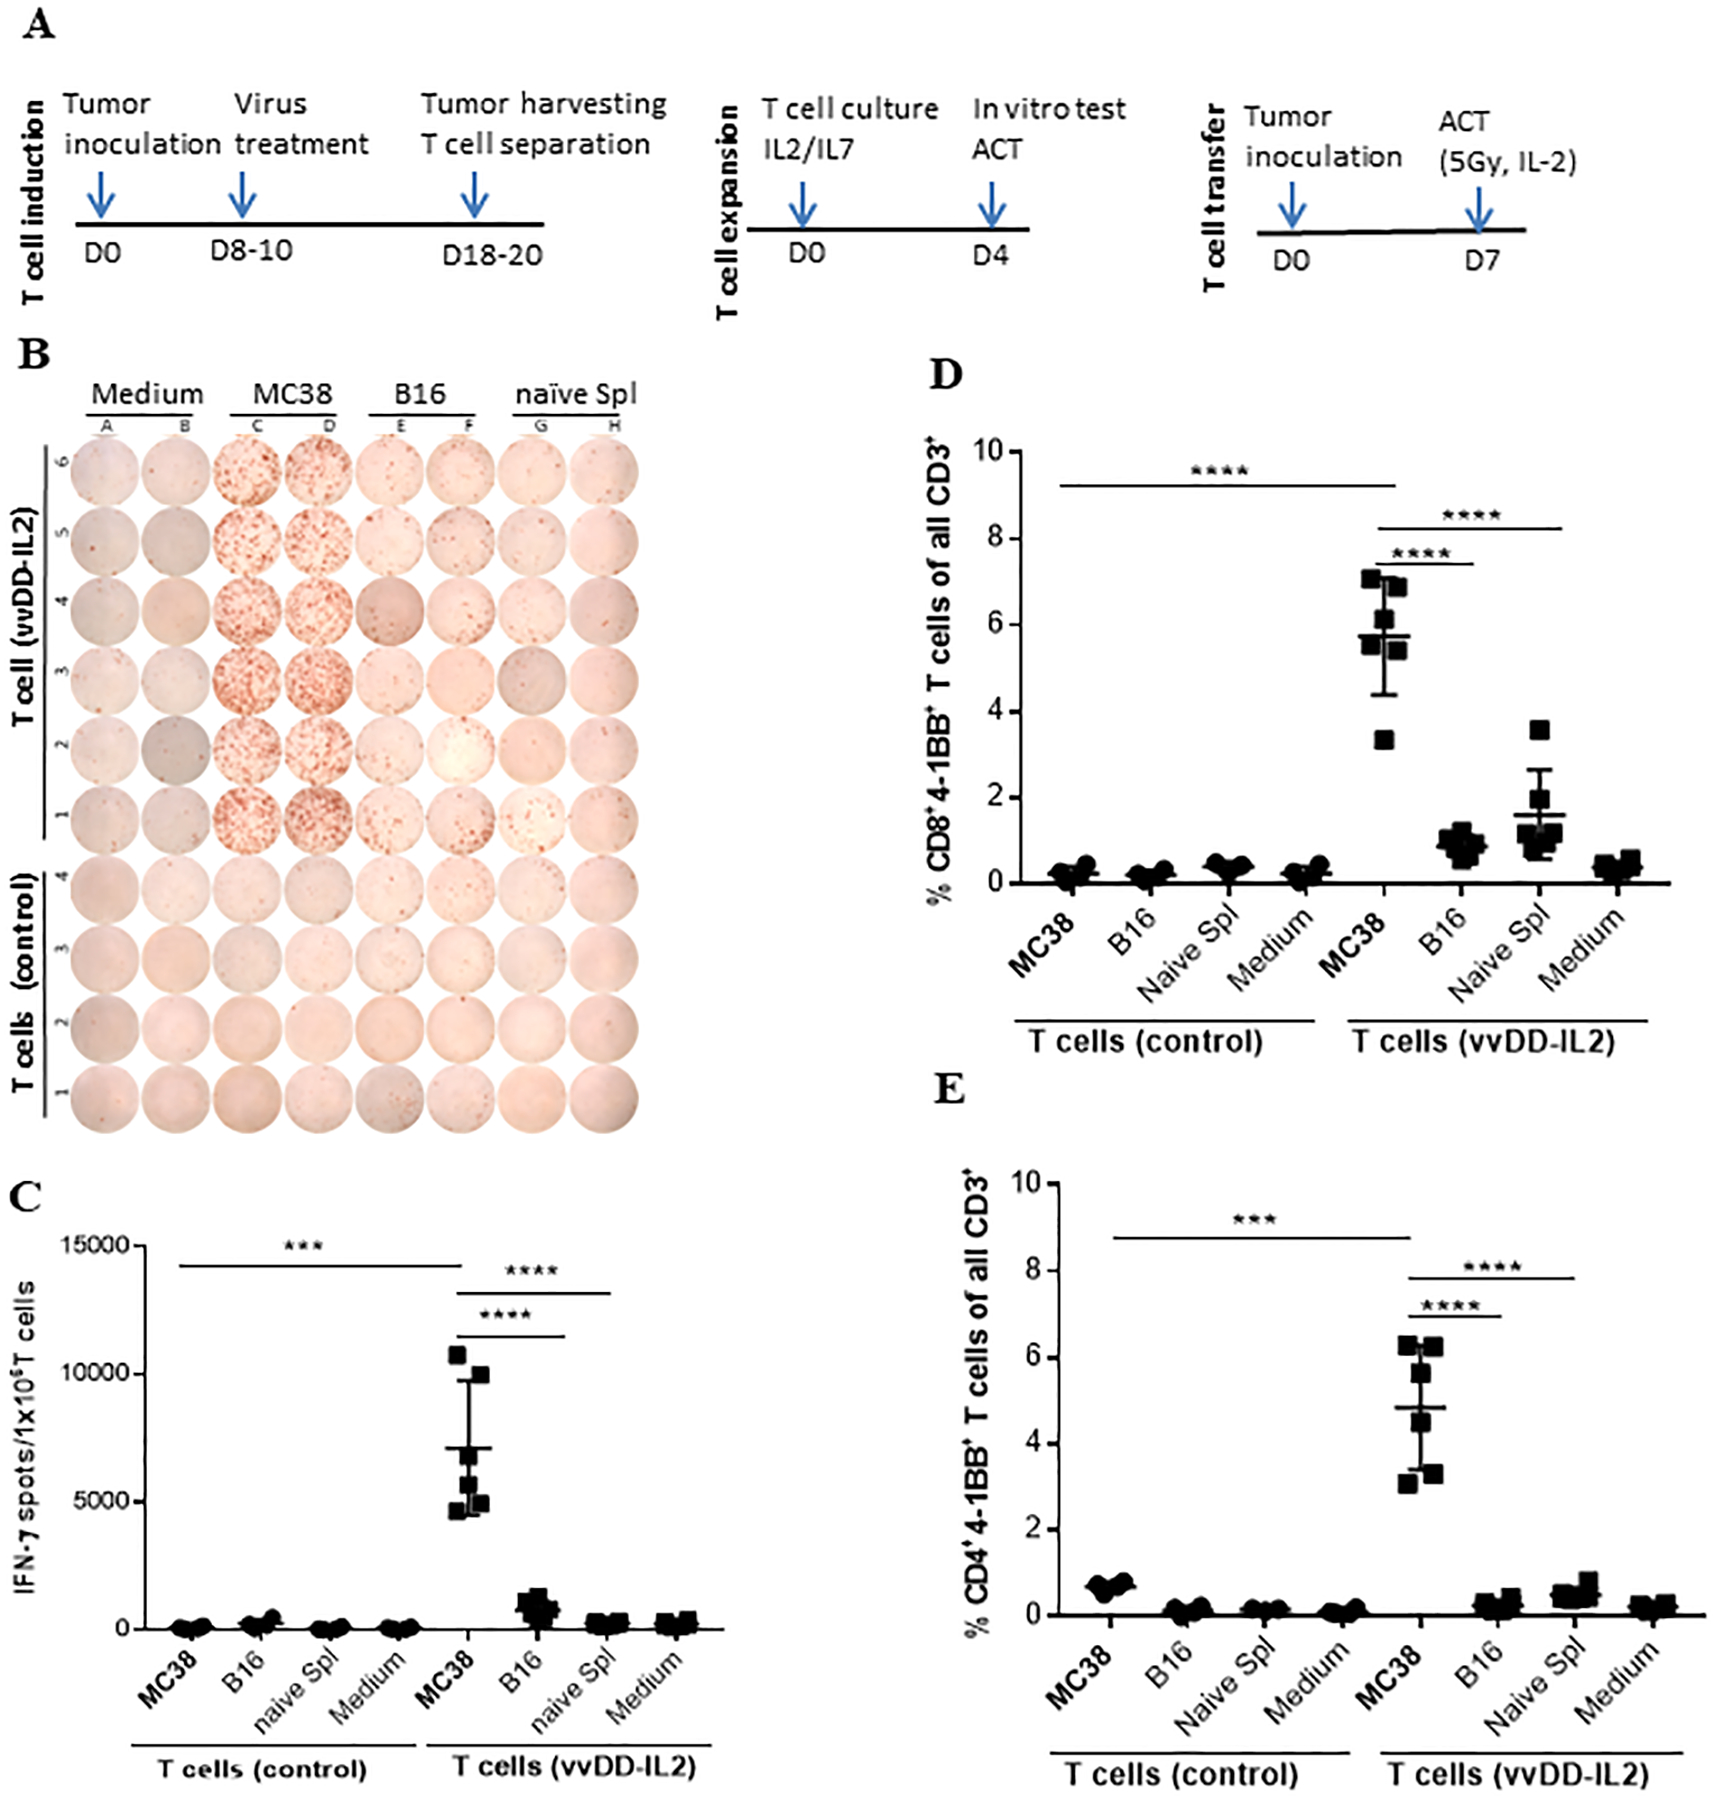
Figure 5. Analysis of the vvDD-IL2 induced TILs after ex vivo expansion.

Prior to ACT, samples (T cells from naïve spleens: n = 4; TILs: n = 6) of the ex vivo cultured and expanded TILs were tested for tumor reactivity using IFN-γ ELISpot assay and co-culture assays for 4–1BB expression analyzed by flow cytometry as described previously. (A). Schema of experimental procedure. (B, C). Shown are (B) the ELISpot plate and (C) calculated IFN-γ+ spots per 1.0e6 T cells. (D, E). The cultured and expanded TILs were analyzed for cell surface 4–1BB expression of (D) CD4+ and (E) CD8+ T cells by flow cytometry. For multiple group comparison One-way ANOVA was used. *p < 0.05; **p < 0.01; ***p < 0.001; ****p < 0.0001.
