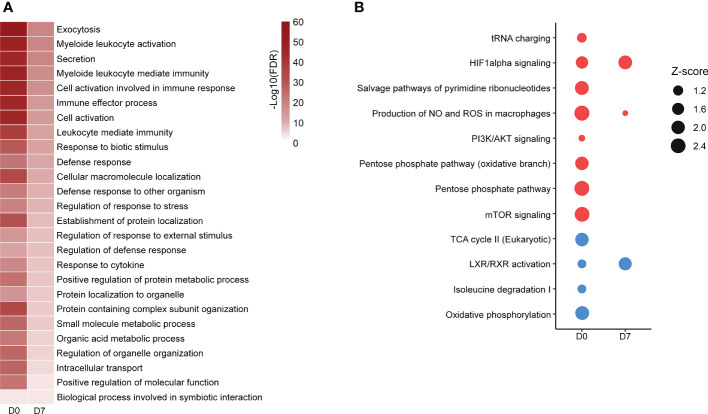
Figure 1.
Altered pathways in septic patient’s proteome ad D0 and D7. (A): Gene ontology biological processes significantly enriched at D0 and D7. Color scale represents -Log10 (FDR). (B): metabolism-targeted IPA analysis. All selected pathways presented B–H p-value <0.05. Dots size represents the z score, which predicts the activation (red dots) or inhibition (blue dots) of a given pathway. Proteomic data from patients at D0 were obtained from (16).

