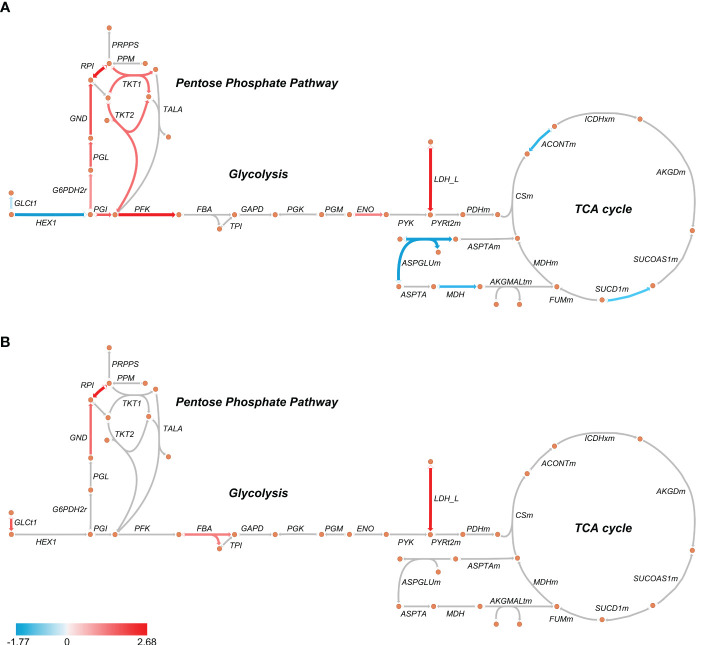
Figure 2.
Schematic representation of glycolysis, pentose phosphate pathway, and TCA cycle in septic patients’ PBMCs at D0 (A) and D7 (B). The arrows indicate enzymes catalyzing each reaction. Red arrows indicate an average upregulation and blue arrows indicate an average downregulation based on the Log2 (fold-change) compared to healthy volunteers. Metabolic maps were generated using Escher.

