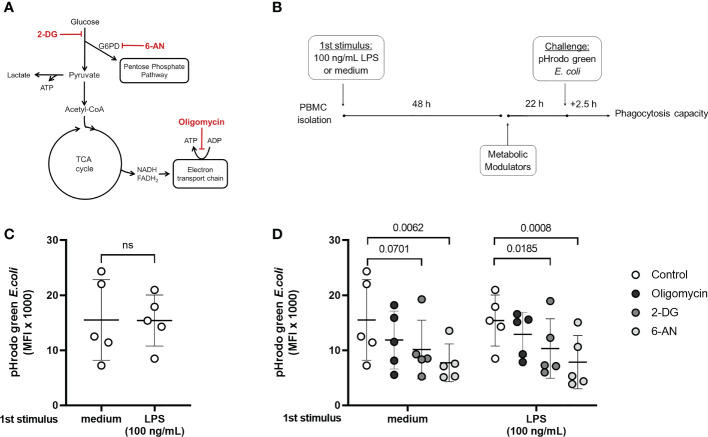
Figure 4.
Phagocytic capacity in control and endotoxin tolerant PBMCs is affected by the modulation of cell metabolism. (A): Schematic figure of the inhibition of cell metabolism using 2-DG, 6-AN, and Oligomycin and its specific targets. (B): PBMCs were incubated for 48h (1st stimulus) with medium or 100 ng/mL of LPS, washed, and incubated for 22 h with the metabolic modulators before exposition to pHrodo green E. coli particles for 2.5 h. (C): Phagocytic capacity of control (medium) and endotoxin tolerant (100 ng/mL LPS) CD14+ monocytes measured as the median fluorescence intensity (MFI) of pHrodo green by flow cytometry. (D): Phagocytic capacity of control and endotoxin tolerant monocytes incubated with metabolic inhibitors. Graphs show mean and SD and each dot represents one individual donor evaluated in all experimental conditions (n = 5 donors); p-values indicate differences between each condition as measured by paired Student’s t-test (C) or repeated measures one-way ANOVA followed by Bonferroni posttest (D). ns, not significant.

