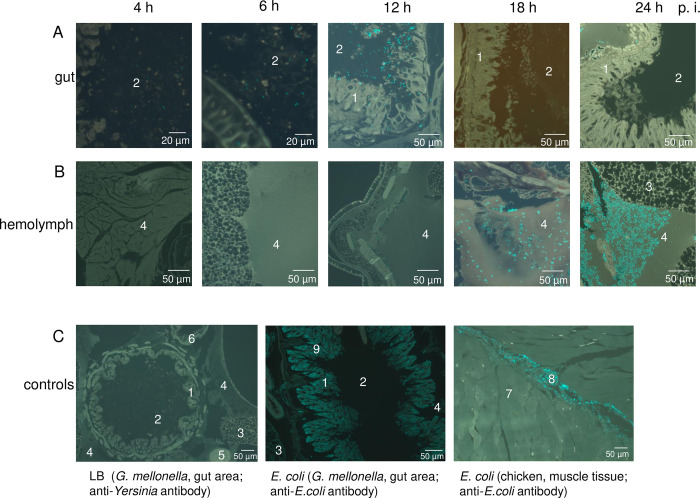
Fig 5. Time course of G. mellonella infection by Y. enterocolitica W22703.
The tissue sections monitored by fluorescence microscopy show antibody-stained Y. enterocolitica cells in the (A) gut or (B) hemolymph of G. mellonella 4 h, 6 h, 12 h, 18 h, and 24 h after infection. (C) The controls depict the gut area of G. mellonella that were fed with LB (left) or infected with E. coli (middle) 24 h ago. The tissue sections were stained with a Yersinia-specific or an E. coli-specific antibody. Functionality of the anti-E. coli antibody was demonstrated by the application of E. coli into muscle tissue of chicken (right). Cyan-coloured areas in the gut area of G. mellonella are unspecific bonds of the anti-E. coli antibody. Representative preparations are shown; the scale is indicated. 1 = intestinal epithelium, 2 = intestinal lumen, 3 = fat tissue, 4 = hemolymph, 5 = appendix, 6 = Malpighian vessels, 7 = muscle cells, 8 = E. coli, 9 = antibody cross reactions.

