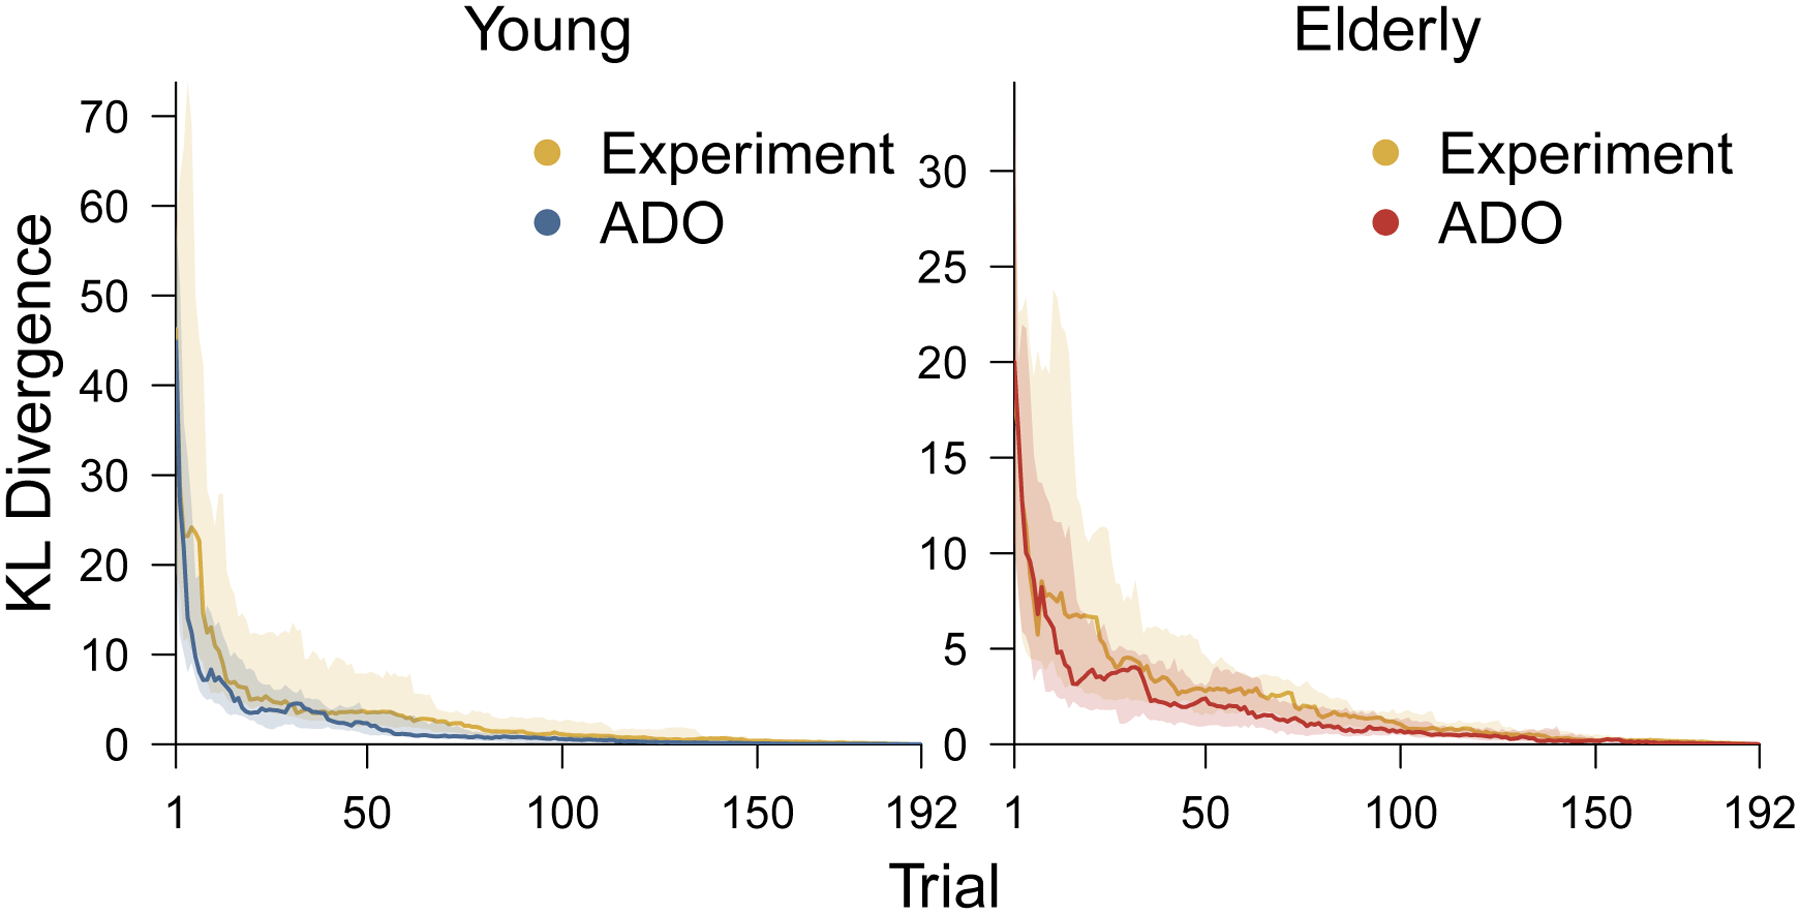
Figure 6.

The distribution of change in KL divergence over trials for the ADO and experimental orders. The left panel corresponds to young participants and the right panel corresponds to elderly participants. Within each panel the blue (for young) and red (for elderly) shaded region shows the interquartile range of KL divergence across all participants, and the solid blue and red lines show the median. In both panels, the shaded yellow region shows the interquartile range of KL divergence for the experimental order and the solid line shows the median.
