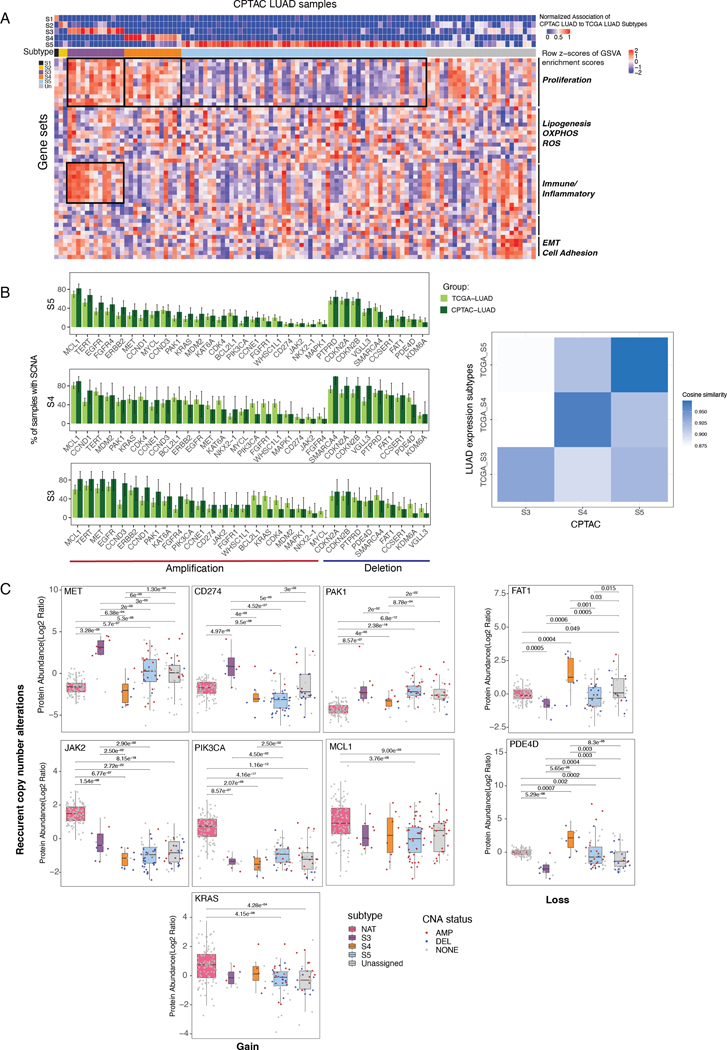
Figure 3. Proteogenomic analysis of genes with subtype-specific recurrent SCNAs.
(A) Top heatmap shows CPTAC LUAD sample association to the expression subtypes. Center heatmap shows the GSVA pathway activation profiles. Boxed pathways are consistent with TCGA LUAD.
(B) Barplots show the proportion of TCGA/CPTAC LUAD samples in S3-S5 with gene amplification (red) or deletion (blue) for genes with recurrent SCNAs. Right heatmap shows the cosine similarity among S3-S5 tumors in TCGA and CPTAC data.
(C) Boxplots show protein abundance of recurrent SCNAs genes across CPTAC LUAD expression subtypes and their normal adjacent tumors (NAT). Copy number states are denoted (red: amplification; blue: deletion; gray: no SCNAs).

