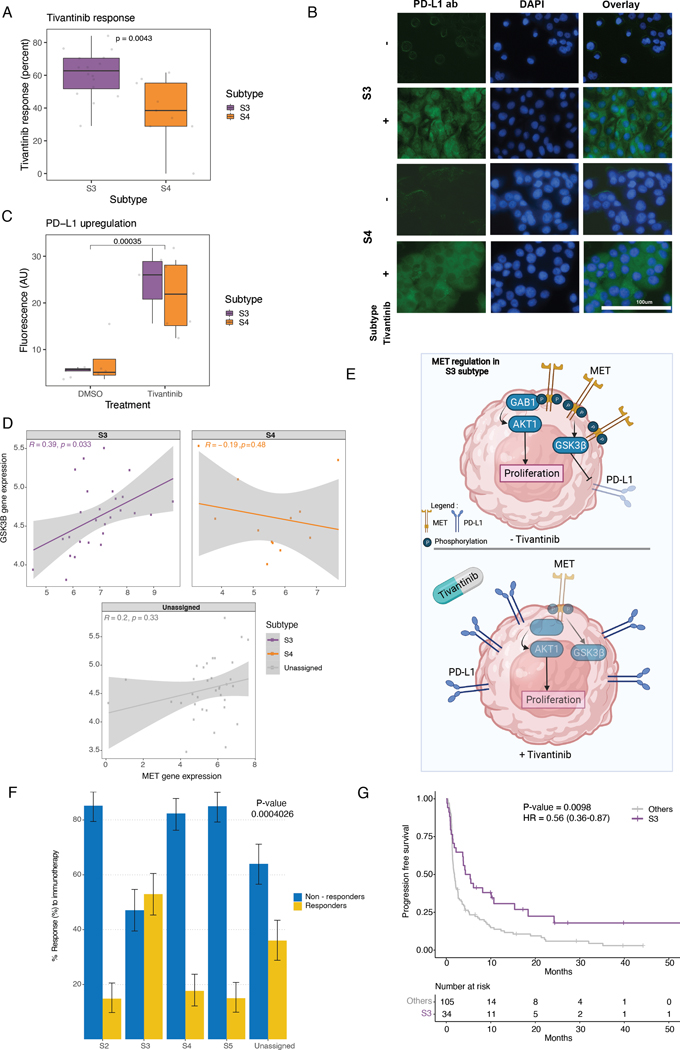
Figure 5. c-MET inhibition drives PD-L1 expression in cell lines.
(A) Boxplots show response to tivantinib measured by the delta change in confluency between treated and untreated (DMSO only) cell lines.
(B) Immunofluorescence staining under tivantinib treatment (x40). Anti-PD-L1 antibody (Green; right); DAPI nuclear staining (Blue; middle), and overlay (left). Bar scale was adapted from another region on the same slide and superimposed on the figure.
(C) Fluorescence quantification shown in boxplots using ImageJ software after background correction.
(D) Scatter plots show correlation between MET expression and GSK3β expression in CCLE data across different subtypes.
(E) Schematic diagram shows MET as a proliferation core regulator and PD-L1 expression regulation by GSK3β in S3 tumors, both without (top) and with (bottom) tivantinib treatment.
(F) Proportion of responders and non-responders across subtypes. S1 excluded due to small sample size. (Chi-squared test P value shown).
(G) Kaplan-Meier curves for the disease-specific survival (DSS) between S3 tumors and others. (Log-rank test P value shown)

