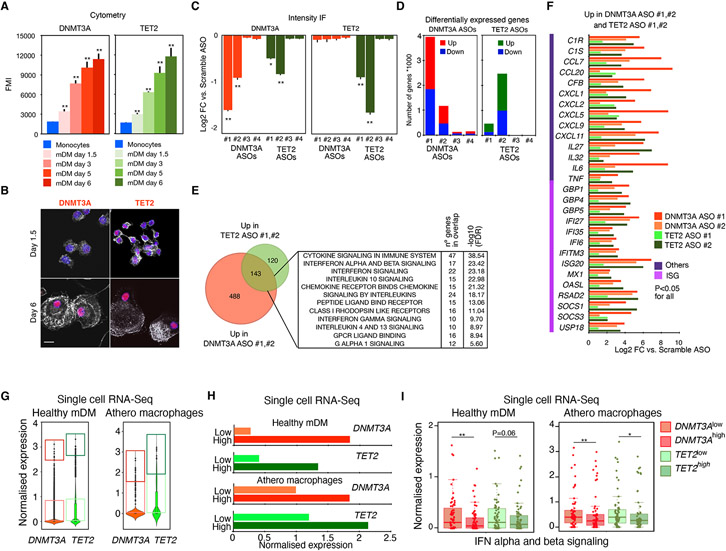
Figure 1. Transcriptional effect of DNMT3A and TET2 ablation in normal and atherosclerotic macrophages.
(A) Intracellular staining analysis of DNTM3A and TET2 by flow cytometry at different stages of differentiation of monocyte-derived macrophages versus circulating monocytes (day 0) (n = 3 donors/experiment, 1 representative donor is shown). Scale bars: 5 μm.
(B) IF analysis of DNMT3A and TET2 in monocyte-derived macrophages 6 days after differentiation versus 1.5 days (n = 3 donors/experiment, 1 representative donor is shown). Scale bars: 5 μm.
(C) Protein quantification of DNMT3A and TET2 by IF in monocyte-derived macrophages transfected with the indicated ASOs against DNMT3A or TET2. (n = 3 donors).
(D) Bar plots showing the number of differentially expressed genes (DEG) in monocyte-derived macrophages transfected with the indicated ASOs targeting DNMT3A or TET2 (n = 3 donors).
(E) Venn diagram showing overlap between upregulated genes in both DNMT3A ASO and TET2 ASO and associated gene ontology term enrichment.
(F) Log2 fold change of the indicated interferon stimulated genes (ISGs) and other inflammatory genes in MDM treated with DNTM3A ASOs or TET2 ASOs. Adjusted p < 0.05 for all versus control ASO.
(G) Macrophages differentiated from monocytes isolated from individuals with no mutations (left panel) or macrophages isolated from atherosclerotic plaque (right panel) were stratified by DNMT3A or TET2 expression according to single-cell RNA-seq. Data corresponds to normalized expression values. (n = 3/group). Boxes denote upper (DNMT3AHigh and TET2High) and lower (DNMT3ALow and TET2Low) quartiles of expression, excluding cells with 0 values.
(H) Bar graphs of the average expression values of DNMT3A or TET2 in DNMT3ALow versus DNMT3AHigh or TET2Low versus TET2High in healthy macrophages or atherosclerotic macrophages, respectively, as defined in (G).
(I) Boxplot of expression of interferon stimulated genes determined by scRNA-seq data of MDM from healthy donors (left) or from macrophages isolated from atherosclerotic plaques (right) in cells with low DNMT3A or TET2 compared to high DNMT3A or TET2 as defined in (G), respectively. Data corresponds to normalized expression values. Mann-Whitney U test was used to calculate statistical significance. *p < 0.05; **p < 0.01. Also see Figure S1.

