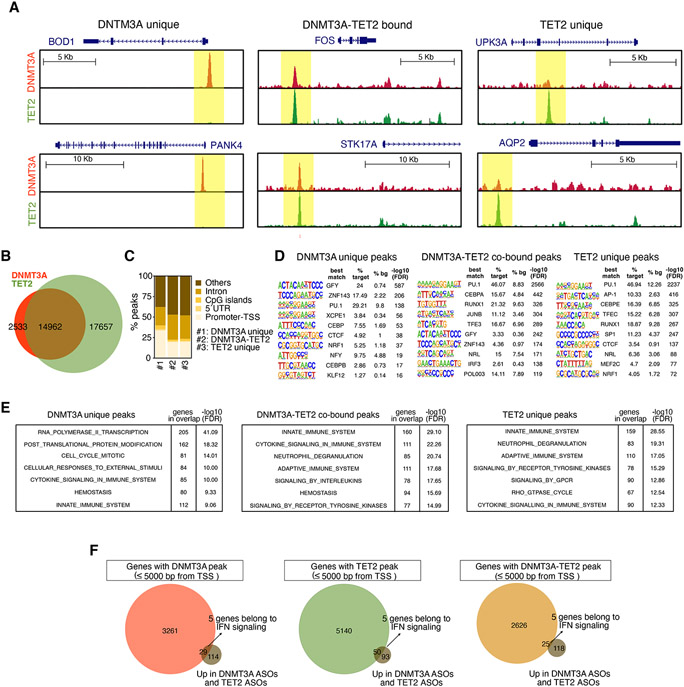
Figure 4. Genome-wide occupancy of DNMT3A and TET2.
(A) Composite of genomic regions bound by DNMT3A only (left), by DNTM3A and TET2 (center), or by TET2 only (right).
(B) Venn plot showing the overlap of all irreproducible discovery rate (IDR) peaks of DNMT3A and TET2 ChIP-seq (n = 4 donors).
(C) Analysis of genomic distribution of DNMT3A or TET2 peaks (promoters defined by 1,000 bp upstream of TSS).
(D) De novo motif analysis of DNMT3A (left) or TET2 (right) ChIP-seq peaks.
(E) Pathway analysis of genes associated with DNTM3A unique peaks (left), or 25% of top best DNTM3A-TET2 cobound peaks (center), or 25% of top best TET2 unique peaks (right).
(F) Venn plots of integrative analysis of upregulated genes in DNMT3A ASOs and TET2 ASOs with DNTM3A peak (left), TET2 peak (center), or DNMT3A-TET2 peak (right) as defined by 5,000 bp upstream of the TSS. Also see Figure S4.

