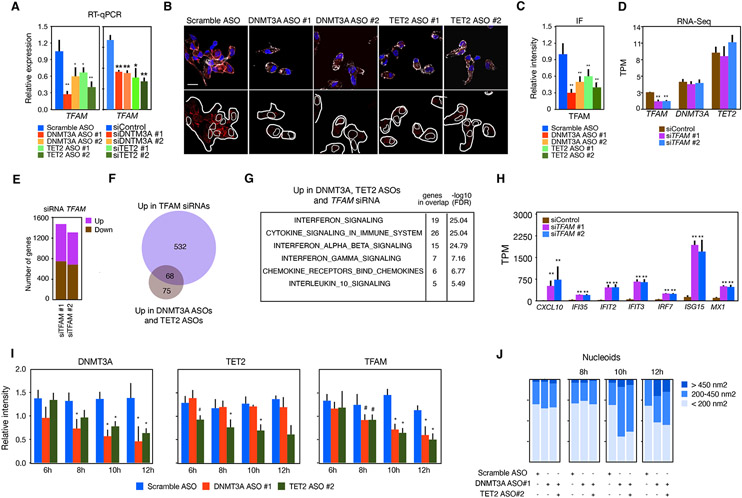
Figure 6. DNMT3A and TET2 regulate the TFAM gene to restrain activation of ISGs.
(A) RT-qPCR analysis of TFAM expression in MDM treated with DNMT3A ASOs or TET2 ASOs or siRNAs for DNMT3A or TET2 (n = 5 donors for ASOs and n = 3 donors for siRNA).
(B) Protein expression by IF in MDM treated with DNMT3A ASOs or TET2 ASOs (n = 2 donors). Scale bars: 10 μm.
(C) Quantification of protein expression shown in (B), downregulation in MDM treated with DNMT3A ASOs or TET2 ASOs (n = 2 donors).
(D) Bar plots showing the number of differentially expressed genes in MDM treated with siTFAM 1 or siTFAM 2 versus siControl.
(E) Bar plot showing reduced expression of TFAM (but not DNMT3A or TET2) in MDM treated with siRNAs for TFAM.
(F) Venn plot showing the overlap between genes upregulated by DNTM3A ASOs and TET2 ASOs in MDM incubated with siRNAs for TFAM.
(G) Pathway analysis of genes upregulated by DNMT3A ASOs, TET2 ASOs, and by TFAM siRNA showing enrichment in interferon signaling genes.
(H) Bar plot showing the upregulation of IFN-stimulated genes in cells treated with siRNAs for TFAM.
(I) Protein expression by IF of DNMT3A (left), TET2 (center), and TFAM (right) showing DNMT3A and TET2 reduction at 8 h, whereas TFAM reduction occurs at 10 h in MDM treated with DNMT3A ASOs or TET2 ASOs (n = 5 donors, one representative donor is shown).
(J) Quantification of cytosolic nucleoids in MDM treated with DNMT3A ASOs or TET2 ASOs (n = 3 donors). Mann-Whitney U test was used to calculate statistical significance. *p < 0.05; **p < 0.01 except panel in (I) where Student’s t test was used to calculate statistical significance. Also see Figure S6.

