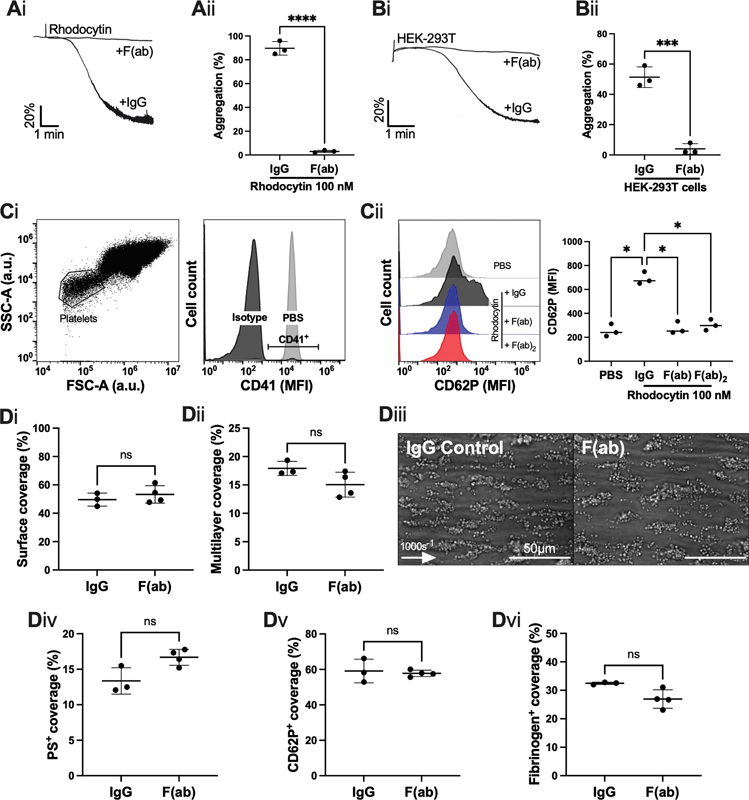
Fig. 3.

The effect of inhibition of CLEC-2 inhibition by AYP1 fragments on platelet aggregation and thrombus formation on collagen under flow. ( A, B ) Washed platelet aggregation was assessed by light transmission aggregometry, in the presence or absence of AYP1 fragment, F(ab) (10 µg/mL). ( Ai ) Representative platelet aggregation trace induced by rhodocytin (100 nM) and ( Aii ) maximum aggregation ( n = 3 donors). ( Bi ) Representative platelet aggregation trace induced by HEK-293T cells and ( Bii ) final aggregation ( n = 3 donors). ( C ) Inhibition of CLEC-2 by F(ab) or F(ab) in whole blood was assessed by flow cytometry in the presence of rhodocytin (100 nM) for 20 minutes. ( Ci ) Platelets were identified by size, and their expression of CD41 in whole blood, and ( Cii ) their activation was measured by CD62P mean fluorescence intensity (MFI) by an Accuri C6 flow cytometer ( n = 3 donors). ( D ) Whole blood from healthy volunteer donors was perfused through a Maastricht flow chamber at 1000 s −1 , in the presence or absence of F(ab) (10 µg/mL) 10 minutes prior to perfusion. The flow chamber was coated with Horm collagen (100 µg/mL). ( Di ) Thrombus surface coverage and ( Dii ) and multi-layered thrombus size shown after perfusion for 3.5 minutes. ( Diii ) Representative images shown after 3.5 minutes ( n = 3 donors; arrow indicates direction of flow). ( Div ) Phosphatidylserine (PS) exposure, ( Dv ) P-selectin expression (CD62P), and ( Dvi ) fibrinogen coverage were assessed with a semi-automated ImageJ script from fluorescent images, shown in Supplementary Fig. S5 . The statistical significance between two groups was analyzed using a paired t -test and the statistical difference between multiple groups was analyzed using one-way ANOVA with Tukey's multiple comparisons test. * p < 0.05, *** p < 0.001. ANOVA, analysis of variance.
