
Fig. 5.
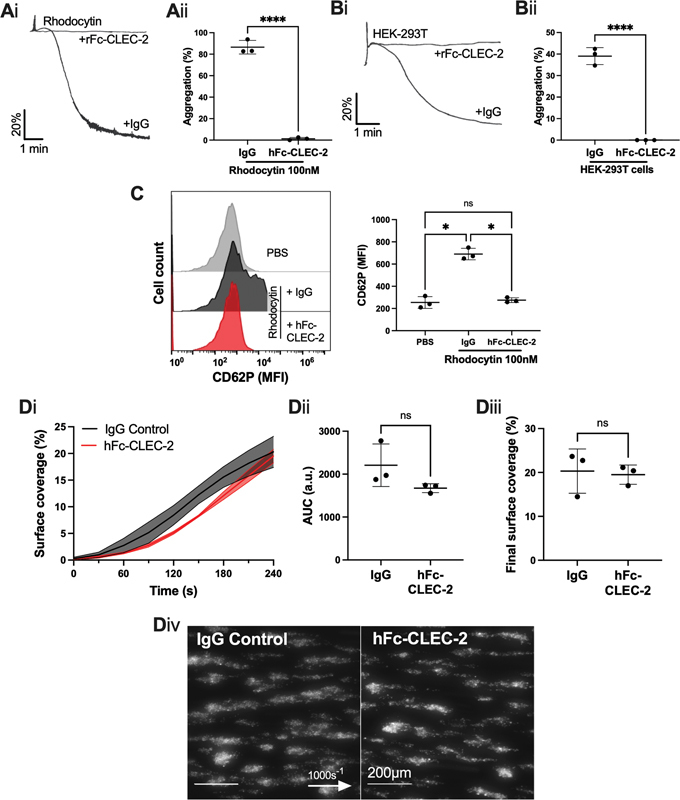
The effect of recombinant human CLEC-2-Fc on platelet aggregation and thrombus formation. ( A, B ) Washed platelet aggregation was assessed by light transmission aggregometry, in the presence or absence of recombinant human CLEC-2-Fc (hFc-CLEC-2) (10 µg/mL). ( Ai ) Representative platelet aggregation trace induced by rhodocytin (100 nM) and ( Aii ) maximum aggregation ( n = 3 donors). ( Bi ) Representative platelet aggregation trace induced by HEK-293T cells and ( Bii ) final aggregation ( n = 3 donors). ( C ) Inhibition of CLEC-2 by hFc-CLEC-2 in whole blood was assessed by flow cytometry in the presence of rhodocytin (100 nM) for 20 minutes. Platelets were identified as shown in Fig. 3(Ci) and their activation was measured by P-selectin (CD62P) median fluorescence intensity (MFI) using an Accuri C6 flow cytometer ( n = 3 donors). ( D ) Whole blood was perfused over Horm collagen-coated (100 µg/mL) µ-Slide VI 0.1 flow chamber at 1000 s −1 , in the presence or absence of hFc-CLEC-2 for 10 minutes prior to perfusion. ( Di ) Thrombus surface coverage over 4 minutes, measured using DiOC6 fluorescence (2 µM). ( Dii ) Subsequent area under the curve (AUC) was calculated (a.u. = arbitrary units). ( Diii ) Thrombus formation after 4 minutes. ( Div ) Representative images shown after 4 minutes ( n = 3 donors; arrow indicates direction of flow). The statistical significance between two groups was analyzed using a paired t -test with Mann–Whitney correction and the statistical difference between multiple groups was analyzed using one-way ANOVA with Tukey's multiple comparisons test. * p < 0.05, **** p < 0.0001. ANOVA, analysis of variance.