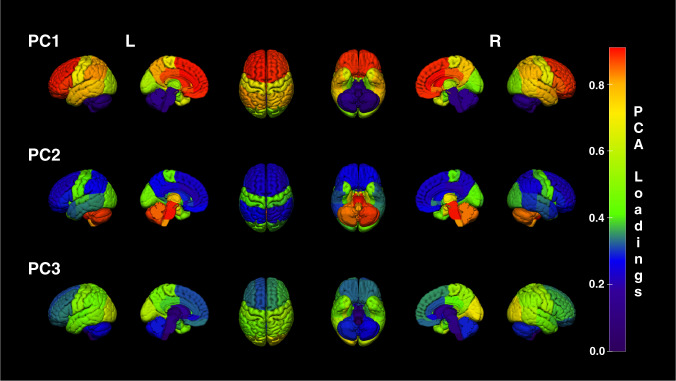
Fig. 1. Representation of regional loadings from the first three PCs.
Each Hammers atlas region was scaled to its loading score from the PCA. The 3D rendering clearly demonstrates the highest loadings for PC1 were obtained in frontal neocortex, followed by striatum (see Supplementary Fig. 4). Highest loadings for PC2 were found in the brainstem and cerebellum, which are often reference regions for SUVR calculations. Highest loadings for PC3 were found in the occipital cortex. The same data are tabulated in Supplementary Table 2. Colour bar represents PC loadings from highest (red) to lowest (violet). PC principal component, L left, R right.

