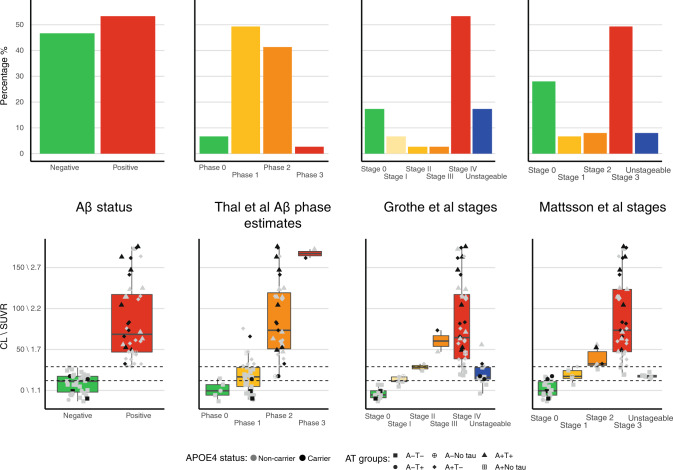
Fig. 3. Bar and box plots displaying the percentage of suprathreshold Aβ within brain regions defined by centiloid cortex and 3 in vivo amyloid staging schemes [7, 8, 11].
The top row shows the percentage of individuals categorised within each amyloid phase/stage, while the bottom row displays the global amyloid (CL\SUVR) for those individuals within each phase/stage. In the bottom row, shape of points represents AT status and colour of points represents APOE4 status (grey non-carriers and black carriers); dotted lines in the box plots represent the boundaries of the grey zone (12–29 CL). The figure demonstrates that independent of method, the majority of the cohort is categorised as having pathological quantities of Aβ. Each staging scheme reveals that those individuals at advanced stages tend to also have higher global CL\SUVRs.

