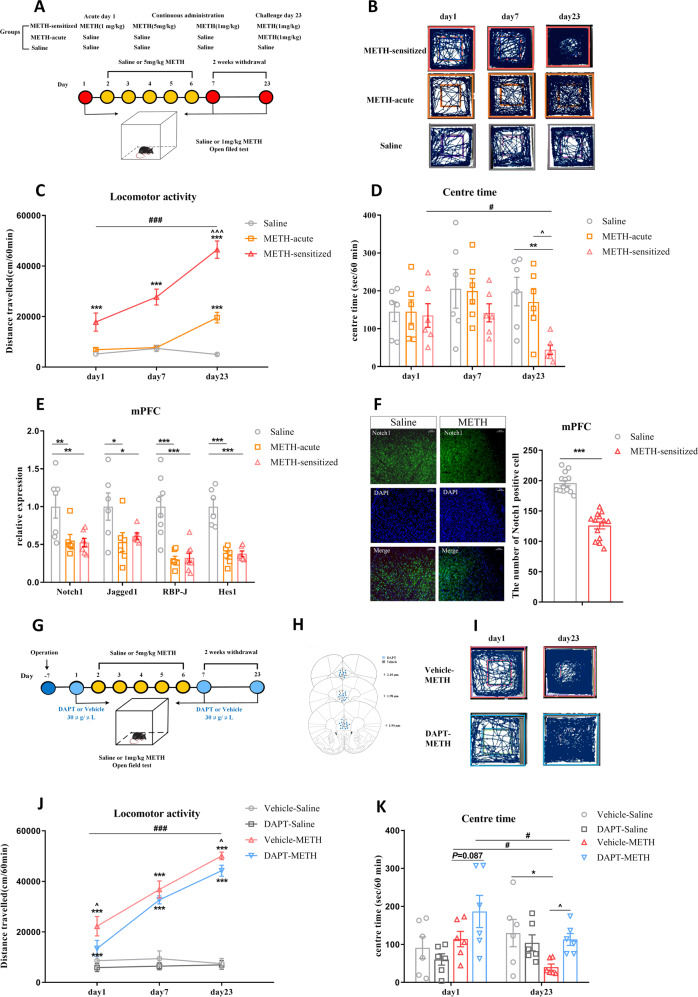
Fig. 1. The involvement of the Notch1 signalling pathway in the mPFC of METH-induced sensitized mice.
A–E Changes in Notch1 signalling in the mPFC of METH-sensitized mice. A Procedure for generating the METH-induced locomotor sensitization model. B Representative mouse tracks from days 1, 7 and 23 were illustrated. C METH-induced locomotor sensitization in mice. One-way repeated-measures ANOVA revealed a significant main effect of METH [F (2, 21) = 47.41, P < 0.001]. Subsequent post hoc LSD comparisons found significantly greater locomotor activity in the METH-sensitized group than in the saline group on day 1, day 7 and day 23. The METH-sensitized group showed a significant increase in locomotor activity compared with the METH-acute group on day 23 and itself on day 1. D The amount of time mice spent in the centre zone significantly decreased in the METH-sensitized group compared with the saline and acute METH group on day 23 [One-way repeated-measures ANOVA, F (2, 15) = 3.66, P < 0.05]. E Changes in the expression of Notch1 signalling pathway components following METH sensitization in the mPFC. There was significant downregulation of Notch1 [F (2, 17) = 6.41, P < 0.01], Jagged1 [F (2, 15) = 3.81, P < 0.05], RBP-J [F (2, 20) = 18.05, P < 0.001], and Hes1 [F (2, 15) = 29.68, P < 0.001] in both the METH-acute and METH-sensitized groups by one-way ANOVA. F Representative images of immunofluorescence staining for Notch1 receptors in mPFC between the METH-sensitized group and the saline group. Quantitative analysis of Notch1-positive cells in the METH-sensitized group showed a significant decrease (t26 = 9.76, ***P < 0.001) by student’s-t test (scale bar = 50 μm, n = 3 / group, 10–15 photos). G–K Intra-mPFC DAPT treatment attenuated METH-induced locomotor sensitization. G Procedure for the administration of DAPT in the mPFC in METH-induced sensitization mice. H Location of the DAPT and vehicle microinjection cannula tips in the mPFC. I Representative tracks of vehicle-METH and DAPT-METH mice on day 1 and day 23. J Intra-mPFC infusion of DAPT significantly attenuated the hyperlocomotion evoked by METH on day 1 and day 23. Mixed-design ANOVA with a LSD post hoc multiple comparison revealed significant main effects of DAPT [F (1, 21) = 5.38, P < 0.05]; METH [F (1, 21) = 206.21, P < 0.001]; but not DAPT×METH [F (1, 21) = 1.36, P > 0.05]. K The time mice spent in the centre zone was higher in the DAPT-METH group than in the vehicle-METH group on day 23. Mixed-design ANOVA with LSD post hoc multiple comparisons show the main effect of DAPT [F (1, 20) = 1.24, P > 0.05]; METH [F (1, 20) = 0.74, P > 0.05] and DAPT × METH [F (1, 20) = 6.45, P < 0.05]. *P < 0.05, **P < 0.01, ***P < 0.001 vs. paired saline group; ^P < 0.05 vs. paired METH group; #P < 0.05, ###P < 0.001 vs. same group on day 1. Data were presented as mean ± S.E.M, n = 6–8.

