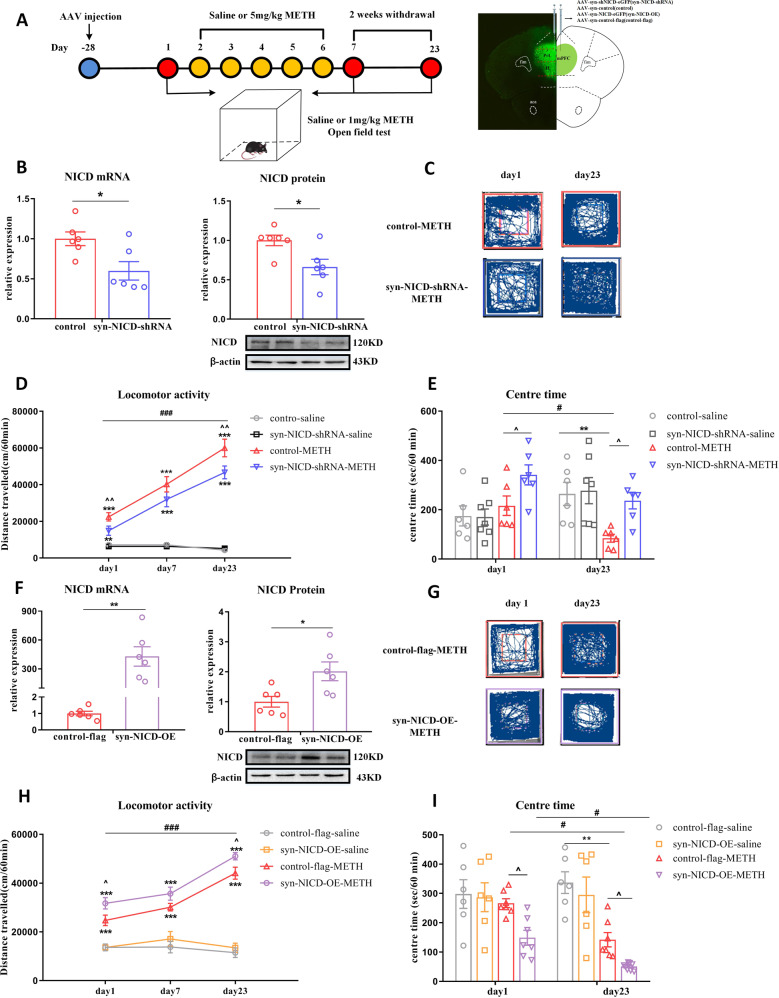
Fig. 2. Manipulating Notch1 expression affects METH-induced locomotor sensitization.
A Timeline of AAV injection, behavioural tests and location of AAV expression. B–E Inhibition of NICD in the mPFC suppressed METH-induced locomotor activity. B NICD mRNA (t10 = 2.79, *P < 0.05) and protein (t10 = 2.84, *P < 0.05) levels were significantly lower in syn-NICD-shRNA group as indicated by student’s t test. C, G Representative paths of mice in the syn-NICD-shRNA-METH and control-METH or syn-NICD-OE-METH and control-flag-METH groups on day 1 and day 23. D Downregulation of NICD in mPFC neurons significantly decreased locomotion on day 1 and day 23. Mixed-design ANOVA with a LSD post hoc multiple comparison revealed significant main effects of AAV [F (1, 20) = 8.95, P < 0.01]; METH [F (1, 20) = 323.81, P < 0.001]; and AAV×METH [F (1, 20) = 8.10, P < 0.05]. E Time spent in the centre zone was significantly higher in the syn-NICD-shRNA-METH group than in the control-METH group on day 1 and day 23 [Mixed-design ANOVA, main effect of AAV, F (1, 21) = 7.61, P < 0.05; METH, F (1, 21) = 0.01, P > 0.05; AAV × METH, F (1, 21) = 7.18, P < 0.05]. F–I Overexpression of Notch1 in the mPFC enhanced METH-induced locomotor activity. F NICD mRNA (t10 = −4.25, **P < 0.01) and protein (t10 = −2.81, *P < 0.05) levels were significantly higher in the mPFC of the syn-NICD-OE group than the control-flag group as determined by student’s t test. H Overexpression of NICD significantly increased locomotion on day 1 and day 23 compared with the control-flag-METH group. Mixed-design ANOVA with a LSD post hoc multiple comparison revealed significant main effects of AAV [F (1, 20) = 8.28, P < 0.01]; METH [F (1, 20) = 241.37, P < 0.001]; but not the AAV×METH [F (1, 20) = 2.70, P > 0.05]. I The time that mice spent in the centre zone was significantly downregulated in the syn-NICD-OE-METH group compared with the control-flag-METH group on day 1 and day 23 [Mixed-design ANOVA, main effect of AAV, F (1, 22) = 6.50, P < 0.05; METH, F (1, 22) = 32.14, P < 0.001; AAV × METH, F (1, 22) = 2.09, P > 0.05]. *P < 0.05, **P < 0.01, ***P < 0.001 vs. paired saline group; ^P < 0.05 vs. paired METH group; #P < 0.05, ###P < 0.001 vs. same group on day 1. Data were presented as mean ± S.E.M, n = 6–8.

