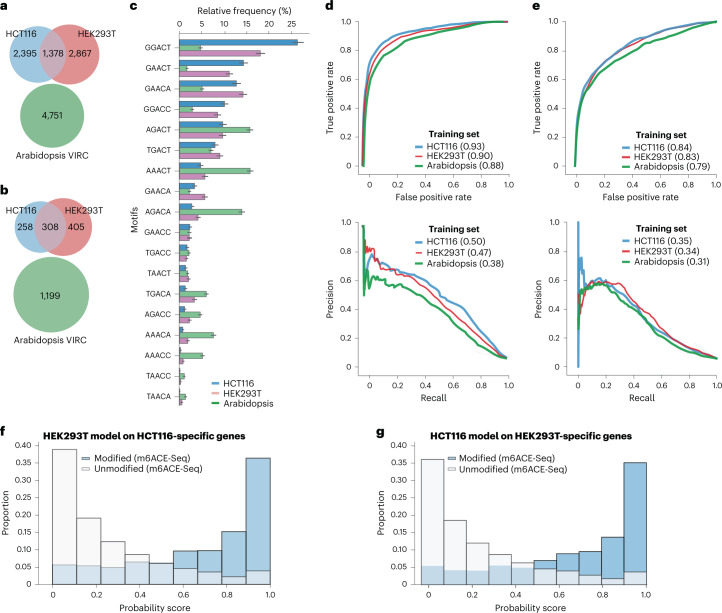
Fig. 2. Comparison of m6Anet model across two different cell lines.
a,b, Distribution of modified positions across all three cell lines on the training (a) and the test (b) sets (area shown to proportion). c, Bar plot comparing the relative proportion of methylated motifs for the HCT116, HEK293T, and Arabidopsis VIR-1 complemented mutant (VIRC). The bar plot center represents the proportion of predicted modified sites for each fivemer motif over all predicted modified fivemer sites while the error bar represents the estimated 95% confidence interval around the center values with n = 5,475 for HCT116 predicted modified positions, n = 6,804 for HEK293T predicted modified positions, and n = 13,089 for VIRC predicted modified positions. d, ROC curve (top) and PR curve (bottom) of the models trained on the HCT116 train set, HEK293T train set, and Arabidopsis training set, and tested on the HCT116 Test set. e, ROC curve (top) and PR curve (bottom) of the models trained on the HCT116 training set and HEK293T training set, and Arabidopsis training set, and tested on the HEK293 test set. f,g, Distribution of probability score of HEK293T (HCT116) model on the genes that are expressed only on the HCT116 cell test set (HEK293T test set). Histogram shows that m6Anet trained on both cell lines can make accurate predictions on a set of genes that are not present in their original training data.

