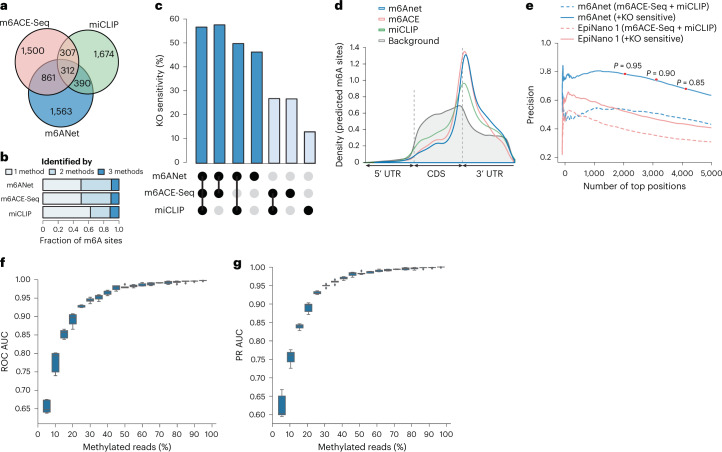
Fig. 3. Performance comparison between m6Anet, m6ACE-seq, and miCLIP on HEK293T cell line.
a,b, Total number of modified sites captured by m6Anet, m6ACE-seq and miCLIP (area in a shown to proportion). c, Percentage of captured sites that a show significant shift in signal distribution against METTL3-KO for each of the three protocols. Statistical significance is defined by P < 0.05 after multiple testing correction using Benjamini–Hochberg procedure where the P value is quantified using xPore. d, Metagene plot of the modified sites captured by the three protocols against the background distribution of all DRACH sites in the data that have at least 20 reads. e, The adjusted precision after including position sensitive to METTL3-KO of m6Anet and EpiNano. Red dots indicate the precision at different probability thresholds. f,g, ROC AUC and PR AUC of m6Anet on different mixtures of methylated and unmethylated direct RNA-Seq reads from synthetic sequences with n = 5 corresponding to five different random mixings of the synthetic and IVT reads for each methylation level. The horizontal lines on the boxes show minima, 25th percentile, median, 75th percentile, and maxima. Points that do not fall within 1.5× the interquartile range are considered outliers and are not shown on the plot.

